1. FOS#
Free and open-source (FOS) geospatial tools and software are essential for data democratization, equitable planning, and preserving natural resources because they provide accessible and transparent ways to analyze and visualize spatial data. Furthermore, increased adoption of open source practices in spatial analysis can enhance the development of the next generation of tools and the wider practice of scientific research and education [Rey, 2009]. FOS tools enable individuals and communities to access, analyze, and share geospatial information regardless of their financial resources. By harnessing them, users can make informed decisions about land use planning, resource management, and environmental conservation. Additionally, the open nature of these tools fosters collaboration and innovation among diverse stakeholders, leading to more inclusive and sustainable solutions for our communities and the environment. Ultimately, FOS geospatial tools are crucial in promoting transparency, equity, and sustainability in decision-making processes related to biodiversity conservation.
1.1. Participatory Rural Appraisal#
For a portion of my graduate school research, I did community-based mapping, working with indigenous villages in a community-run reserve called Chimalapas in Oaxaca, Mexico, using participatory rural appraisal (PRA) tools. PRA involves local community members in the assessment process, enabling them to actively contribute their knowledge, experiences, and perspectives regarding natural resources (Fig. 1.1). This inclusive approach ensures that the assessment reflects the needs and priorities of the community, leading to more relevant and sustainable resource management decisions. Secondly, PRA fosters community empowerment by building local capacity, enhancing collective decision-making, and promoting ownership of development initiatives.
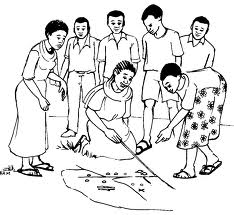
Fig. 1.1 Participatory rural appraisal session led by local community member.#
The tools are simple; mapping can be drawing a diagram in the dirt or sand or working with villagers to create a model of how they perceive their local landscape. Other tools can involve using rocks or beans to quantify seasonal differences in crop yields or natural resource utilization. The exercises aimed to develop the spatial perception of how communities perceived their geography and determine what was important in managing and living in the natural world.
My point is that mapping can be as simple and free as you want, especially to create something meaningful for your audience. Visual representation of maps and data is possible in any community. However, using the right tools for the analysis is critical and you cannot assume everyone understands the process or outcomes. I learned as much from developing maps in the dirt as I have from analyzing rasters for land use change or running regressions with multiple variables to develop machine learning models.
1.2. Modern GIS#
Geographic information systems (GIS) have changed substantially in the past four decades from simple but clunky map layering to complex software processing thousands of data points in multiple dimensions. During this progression, the term GIS has shifted toward geospatial data and data analysis, and data analysis nearly always has a spatial component.
An explosion in data science during the past decade from big data to big data is dead has not only seen data have its long live rock/rock is dead moment it has also seen a proliferation in software and cost to geospatial analysis.
Modern GIS
“…the process, systems, and technology used to derive insights from geospatial data. Modern GIS uses open, interoperable, and standards-based technology. It can be run locally or in the cloud and scale to work with different types, velocities, and data scales.” [Forrest, 2023]
Modern GIS is open and run locally or in the cloud [Forrest, 2022]. This shift from desktop and enterprise systems to cloud-native systems is a quantum leap from past geospatial analysis. This uses efficient and serverless processing, allowing analysis at multiple scales and different users Fig. 1.2.
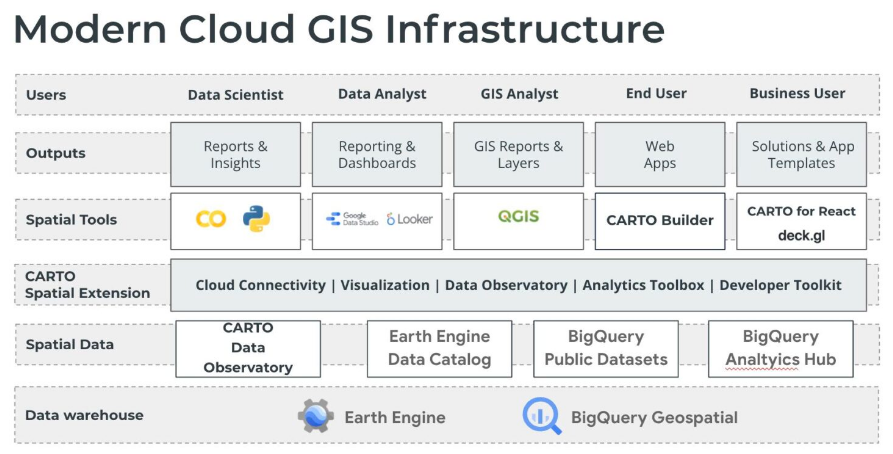
Fig. 1.2 Modern cloud GIS infrastructure [Forrest, 2022].#
1.3. Data Democratization#
Imagine a nonprofit focused on wildlife conservation in a remote corner of the world, striving to protect endangered species and fragile ecosystems amidst mounting challenges. In today’s digital age, data is inundating our world at an unprecedented rate, offering valuable insights crucial for informed decision-making.
However, not all data is readily accessible, and the software required to analyze it often comes with a hefty price tag. This unfortunate reality creates a significant barrier, preventing organizations and communities in need from harnessing the power of data-driven solutions. Regrettably, the areas most in peril, facing the looming threats of destruction and extinction, are often located in developing regions where resources to combat threats to the natural world can be scarce.
Data democratization is essential to bridge this gap, ensuring that vital information is accessible, empowering conservation efforts, and safeguarding our natural world for future generations. Accessible data and imagery depend on free and open-source software. The challenge with free and open-source software is that it usually requires coding knowledge, a barrier for some without a computer science background. Large language model artificial intelligence may address this issue by bridging the gap between deploying complex software for geospatial data analysis and visualization. ChatGPT’s Geo+ can turn prompts into maps, but it still costs money to run. Many examples from the past year seem promising in this realm, but this promise still surpasses the reality of democratized use.
1.4. Challenges/Solutions#
The solution is to learn how to code, and fortunately, many resources are available, from YouTube to online tutorials and blogs. However, there are still challenges. I offer a few along with suggested solutions:
Coding language. There are four main languages in this book. Which one should you learn first? I recommend starting with Python. Python basics provides an excellent foundation for starting in Python, and freeCodeCamp has many tutorials to complement this resource. Don’t just view and read, practice!
Resources are everywhere. This is true, and you need to sort through what works and what is of high quality and find answers when you encounter errors. This book is meant to centralize key resources for geospatial analysis. Don’t forget that you can always search for an error online or ask large language models such as Chatgpt, Gemini, and Copilot to help solve errors. The models and online resources such as Stack Exchange don’t always work, but they will often get you ‘unstuck’. One bonus of many open-source software is their associated communities. QGIS has an incredible community connected to it, and Earth Engine has a large Google chat group where you can often search for answers to your questions.
Directions don’t make sense. Sadly, this is a frustrating aspect in a world of coders who all seem to understand the lingo and jargon, and you do not. It can often feel like deciphering the terrible instructions that came with a gadget you recently ordered online. I try to simplify some key tools in this book, but sometimes you may need to try things many times or contact the developers and ask what they mean. Videos can often help translate instructions or commands or provide different insights into how code works.
Errors. Sometimes, software doesn’t work. Sometimes, you’re just not doing it right. My only suggestion is to keep trying. Leave the work for a while, and then come back to it. Search for solutions, then try them out. Try out different codes in a separate file. Jupyter notebooks are great for isolating code blocks to help you see where errors occur. The Python chapter still has an error from one command that works in Google Colab but not a Jupyter Notebook, for instance. Github Copilot, although it does require a subscription, is useful for fixing errors. If you’re a student, Copilot is free. If not, try other large language models, some of them are now open source and local, e.g., you can install them on your computer and run on your hard drive.
Visualization. Conveying results to your audience(s) is challenging and fun at the same time. You may often be surprised by what people notice or do not notice from graphs, charts, and maps. Remember that many people experience different forms of color blindness and use online visual checkers to note their colorblindness umwelt[1]. There are scads of inspirational resources for visualization from John Nelson to Wendy Shijia and Tanya Lomskaya. Check out Tanya’s movie color wheel to copy coloramp HEX codes by movie title! Who knew? John’s blogs and YouTube videos are particularly great, combining cartography with visualization, and Wendy Shijia’s visualization skills are otherworldly.