Stress testing your scaling assumptions with a model using defensible economic and biophysical values is critical to future business and project expansion. All figures are approximations for order-of-magnitude stress-testing, not quotes or engineering estimates.
Background
This note stress-tests the decision to scale a pilot community-scale sawmill — processing one MMBF/yr of small-diameter thinning material — into a 3-mill program, using the assumptions-based scaling framework in Salafsky et al. (2021) and outlined in Table 1. The central question is not “can one mill work?” but “what does the system actually require at 3 mills, and does the arithmetic hold?” The headline numbers: three MMBF/yr of lumber demands roughly 45,000 green tons/yr of small-diameter logs, which requires thinning 2,250 acres/yr; the program employs ~54 FTE (36 at the mills, 18 in field thinning crews) at a payroll of $3.15M/yr, and needs $4.5M of installed mill capital. Because small-diameter thinning material is volume-hungry and labor-intensive, feedstock and staff together cost roughly 3x the value of the commodity lumber the mills produce.
Models & Calculations
Table 1:Key Parameters for a community-scale mill processing 1 mmbf/yr. Installed mill capital cost includes equipment, site, building, debarker, edger, trimmer, kiln, and material handling. Units. MBF = 1,000 board feet; MMBF = 1,000,000 board feet; tons = green (un-dried) short tons; $ = USD. All staff figures are full-time equivalents (FTE).
| # | Parameter | Planning assumption (range) | Basis |
|---|---|---|---|
| 1 | Lumber capacity | 1 MBF / yr (4,200 BF per 8-hr shift x 240 operating days) | Scenario |
| 2 | Installed mill capital cost | $1.5 M ($1.0-2.0 M) | Small commercial sawmill equipment $100k-300k for a basic line; medium commercial $500k-2.0 M, plus installation/site/utilities Lawler, 2025EquipmentFinancingHQ, 2026 |
| 3 | Capital intensity | $1.50 per BF installed capacity | $1.5 M / 1 MMBF |
| 4 | Small-diameter logs | 1 MBF lumber 1.7 MBF log-scale (LRF 0.6) | Small-diameter logs yield less lumber per log; Doyle/Int’l-1/4 overrun typical Tennessee Extension, 2023 |
| 5 | Feedstock required | 15,000 green tons/yr (12-15 tons per MBF of lumber; range 10-20) | 1,700 MBF log-scale x 9 tons/MBF for 8-14 in. logs Tennessee Extension, 2023 |
| 6 | Feedstock intensity (vs. industry) | 15 tons/MBF lumber vs. 3.8 tons/MBF at a large industrial mill | Plummer FP: 60 MMBF from 230,000 tons Service, 2008; Gloster: 300 MMBF from 1.0 M tons Forestnet, 2025 |
| 7 | Mill staffing | 12 FTE (range 8-15): mgr, 2 headrig sawyers, edger/trimmer, debarker, 2 log-yard/forklift, maintenance, 2-3 kiln/sort-yard, 1-2 admin/sales | England Sawmills (small-diameter): 9 staff at up to 9 MMBF, expanding to 25 Service, 2008; Yakama small-diameter mill: 110 staff at 30-40 MMBF Service, 2008 |
| 8 | Mill loaded wage | $55,000 / FTE / yr (base $39-43k at $18-21/hr x 1.35 benefits load) | Sawmill worker avg $18.80/hr ZipRecruiter, 2026; $42.7k/yr / $20.51/hr ERI, 2026; sawyer $23/hr Salary.com, 2025 |
| 9 | Payroll | $660,000 / yr (12 x $55k) | Rows 7-8 |
| 10 | Lumber price (wholesale) | $350 / MBF ($250-500) | Community-mill grades (pallet/cant, #3, timbers) price well below commodity; value-added products far higher Service, 2008 |
| 11 | Feedstock delivered cost | $35/ton (planning; range $25-60): $25/ton thinning (stump-to-truck) + $10/ton hauling; stumpage $0-10 (low-value fuel-treatment byproduct) | Thinning cost $21-28/ton Chang, 2023Mitchell, 2009; hauling Chang, 2023Mitchell, 2009. CA-specific costs run far higher: resilience mechanical thin $1,742/ac, hand thin $1,088/ac ($54-87/ton at 20 tons/ac), commercial-thin merchantable timber $59.43/GT, sawlog hauling $23-39/GT Delyser et al., 2025 |
Figure 1 shows revenue vs. operating expenses over 7 years and expansion from one to three mills. The shaded gap indicates the difference between revenue and expenses over this time.
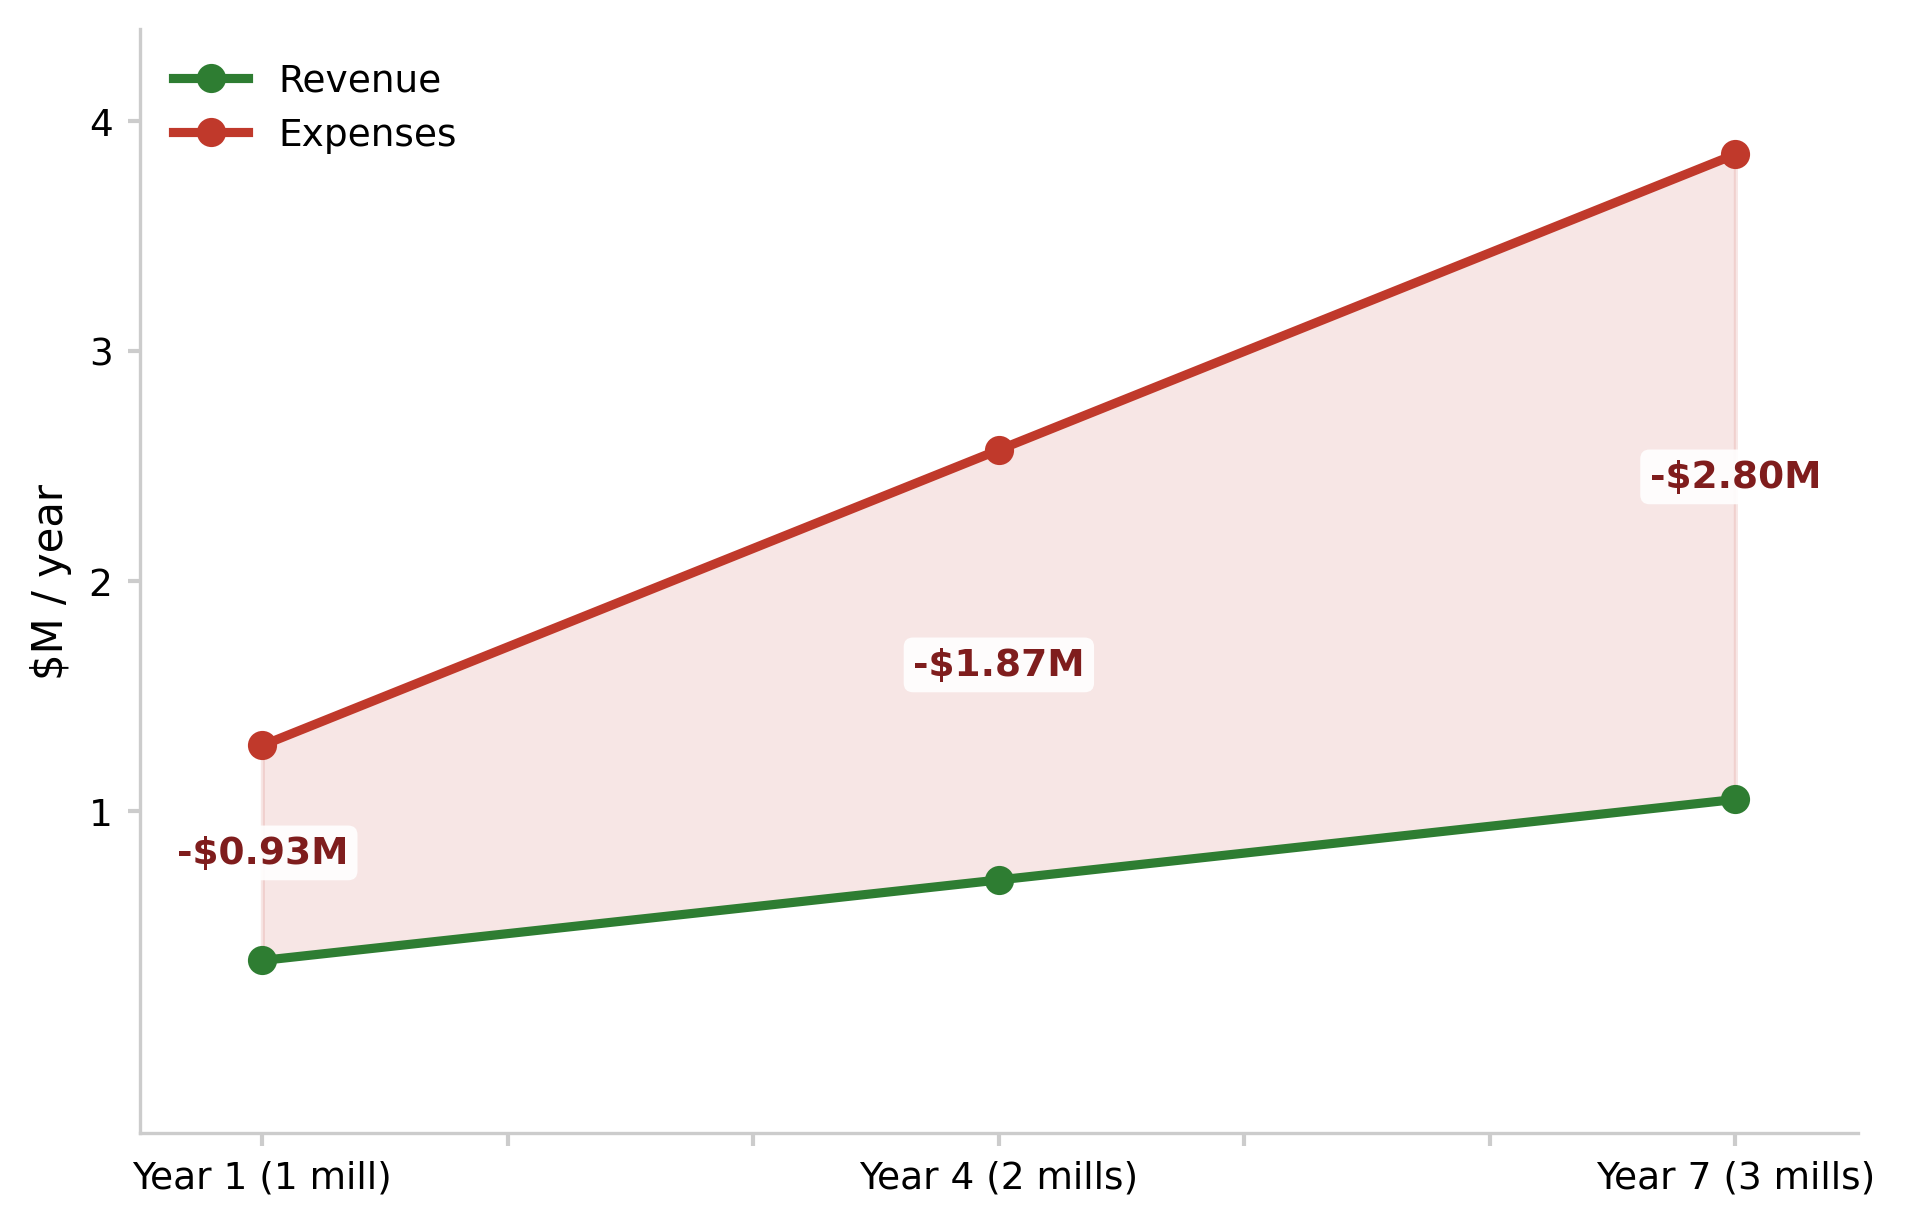
Figure 1:Revenue vs. operating expenses over program ramp-up. Assume one mill added every 3 years; no capital economies of scale at replication (unit costs identical across scale). Shaded gap = annual shortfall before coproducts/subsidies.
Two scaling assumptions fail the stress test in ways that mirror the wetland example Salafsky et al. (2021) provided. First, replication buys no capital economies of scale: three small mills carry the same $1.50 per board foot of installed capital as one, versus $0.67/BF for a single large industrial line. Second, the feedstock and staff base is far larger than intuition suggests: 15 green tons of logs are needed per MBF of lumber (vs. 3.8 tons/MBF for large-log industrial mills), and the payroll alone ($3.15M/yr) exceeds total lumber revenue ($1.05M/yr). The exercise therefore surfaces that the program only pencils out with value-added products (flooring/timbers), coproduct revenue (chips, residue, biochar), or a recurring subsidy on the order of $3M/yr — and that treatment costs vary so widely by region (California mechanical thin at $1,742/ac vs. $500—800/ac western averages) that the planning numbers below should be re-run on local costs before committing Delyser et al., 2025.
The purpose, as in the source framework, is a quick order-of-magnitude reality check rather than a precise financial model: it should reveal which assumptions would sink the program, where to spend effort refining estimates, and how to budget program management, ramp-up, and failure risk at scale Salafsky et al., 2021.
A single community mill does not pencil out from lumber alone: feedstock + staff exceed gross lumber revenue by roughly 3x (Table 2). Most mills close that gap with higher-value products, such as flooring, dimensional lumber, coproducts, log-sort premiums, or timber-sale revenue sharing Service, 2008.
Table 2:Operating Plan for a one MMBF Mill (Annual, Planning Values).
| # | Line item | $ / yr | Basis |
|---|---|---|---|
| 1 | Revenue, lumber (1,000 MBF x $350/MBF) | +$350,000 | Rows 1, 10 of Table A |
| 2 | Revenue, coproducts (chips, sawdust, slabs; sensitivity) | +$50,000-135,000 | 4,000-5,000 tons residue x $25-30/ton; exclude from net below |
| 3 | Cost, feedstock delivered (15,000 tons x $35/ton) | $525,000 | Table A row 11 |
| 4 | Cost, mill staff (12 FTE x $55k) | $660,000 | Table A rows 7-9 |
| 5 | Cost, energy, blades, maintenance, insurance | $100,000 | Equipment-heavy ops Lawler, 2025EquipmentFinancingHQ, 2026 |
| 6 | Cost, depreciation (installed capital / 20 yr) | $75,000 | Non-cash |
| 7 | Total annual operating cost | $1,285,000 (cash); $1,360,000 incl. depreciation | Rows 3-6 |
| 8 | Net (before coproducts, subsidies) | $935,000 / yr | Rows 1-7 |
| 9 | Unit cost | $1,285-1,360 / MBF produced | Consistent with $1.00-1.75/BF cost for small-scale milling Woodpreneur, 2021 |
Program-level parameters added when going from pilot to scale are shown in Table 3.
Table 3:Additional Parameters at PROGRAM Scale (3 Mills)
| # | Parameter | Assumption (range) | Basis / citation |
|---|---|---|---|
| 1 | Program size | 3 mills x 1 MMBF/yr = 3 MMBF/yr | Scenario |
| 2 | Ramp-up/sequencing | 1 new mill + 1 thinning crew every 3 years (mills come online t=0, t+3, t+6; a fast schedule) | Program teams can only initiate so many units per year Salafsky et al., 2021 |
| 3 | Feedstock demand at full build | 45,000 green tons / yr (3 x 15,000) | Table A row 5 |
| 4 | Thinning removal intensity | 20 green tons/acre of merchantable small-diameter material (range 10-40) | Fuel-reduction removals of small stems Chang, 2023Mitchell, 2009 |
| 5 | Acres to treat | 2,250 ac / yr (range 1,100-4,500) | 45,000 tons / 20 tons/ac |
| 6 | Thinning cost (contract, stump-to-truck) | $25 / ton ($21-28); $500/ac at 20 tons/ac | Mechanized whole-tree avg $21.34/ton, $2,075/ha Chang, 2023; mechanical fuel treatments $529-$3,535/ac, median $529 Mitchell, 2009. CA alternative: resilience mechanical thin $1,742/ac, hand thin $1,088/ac, commercial-thin merchantable timber $59.43/GT, biomass $16.99/BDT Delyser et al., 2025 |
| 7 | Annual thinning contract cost | $1.13 M / yr (45,000 x $25) | Rows 3, 6 |
| 8 | Field thinning crews | 3 mechanized crews, 5 FTE each (5-6 ac/day/crew; 750 ac/crew/yr) | Mechanized whole-tree crew profile Chang, 2023Mitchell, 2009 |
| 9 | Field staff (direct-employ model) | 18 FTE (15 operators + 2 foremen + 1 forester/contract admin) | Row 8 |
| 10 | Field loaded wage | $65,000 / FTE / yr (logging equipment operator base $48k x 1.35) | BLS OES logging equipment operators $48k BLS, 2024 |
| 11 | Field payroll (direct-employ alternative) | $1.17 M / yr (18 x $65k) | Rows 9-10. Alternative to contract thinning (row 7); do not double-count |
| 12 | Program management & overhead | 2 FTE + $150k / yr | Program-scale management adds cost not present at pilot scale Salafsky et al., 2021 |
| 13 | Failure/risk events | Feedstock shortfall (fire, drought, permit delay), mill downtime, lumber price drop, crew availability | Periodic minor + major failure events must be modeled Salafsky et al., 2021 |
Table 4 shows the summary model outputs for 1 vs. 3 mills. The staffing model uses direct-employ field crews (Table C rows 9—11); the contract-thinning figure is the market-rate alternative.
Table 4:Summary Model Outputs for 1 vs. 3 mills.
| Metric | 1 mill ($s) | 3 mills ($s) | Ratio |
|---|---|---|---|
| Lumber output (MMBF/yr) | 1 | 3 | 3x |
| Installed mill capital | 1.5 M | 4.5 M | 3x |
| Capital per BF | 1.50 | 1.50 | 1x |
| Feedstock required (green tons/yr) | 15,000 | 45,000 | 3x |
| Feedstock per MBF lumber (tons) | 15 | 15 | 1x |
| Acres treated (ac/yr) | 750 | 2,250 | 3x |
| Mill staff (FTE) | 12 | 36 | 3x |
| Field thinning staff (FTE) | 6 | 18 | 3x |
| Total staff (FTE) | 18 | 54 | 3x |
| Mill payroll ($/M/yr) | 0.66 | 1.98 | 3x |
| Field payroll, direct-employ ($/M/yr) | 0.39 | 1.17 | 3x |
| Total payroll ($/M/yr) | 1.05 | 3.15 | 3x |
| Thinning contract cost @ 25/ton ($/M/yr) | 0.38 | 1.13 | 3x |
| Feedstock delivered @ 35/ton ($/M/yr) | 0.53 | 1.58 | 3x |
| Lumber revenue @ 350/MBF ($/M/yr) | 0.35 | 1.05 | 3x |
| Annual net, pre-subsidy/coproducts ($/M/yr) | 0.94 | 2.8 | 3x |
Lessons
No capital economies of scale by replication. Building three small mills triples capital and keeps unit capital at ~$1.50/BF — versus ~$0.67/BF for a 300-MMBF industrial line Forestnet, 2025. Small-scale replication buys redundancy and community benefits, not capital efficiency (A balancing-loop “limit to growth” in Senge’s terms Salafsky et al., 2021)
Small-diameter feedstock is volume-hungry. ~15 tons of green material per MBF of lumber (vs. ~3.8—4 tons/MBF for large-log industrial operations Forestnet, 2025Service, 2008) means 3 MMBF of lumber demands ~45,000 tons/yr of thinning material and ~2,250 treated acres/yr — a large, sustained land base and a real constraint on scaling.
Staff dominates the cost curve. Payroll (~$3.15M/yr at full build) exceeds total lumber revenue (~$1.05M/yr) ~3-fold. The program cannot stand on commodity lumber; it requires coproduct revenue, value-added products, or ~$3M/yr of subsidy/co-finance — mirroring the conclusion that scaling required a large cash subsidy Salafsky et al., 2021.
Sensitivity levers (change any and re-run): lumber price ($250—500/MBF), value-added product mix (flooring/timbers sell near $1,000/MBF Service, 2008), feedstock cost ($25—45/ton), removal intensity per acre (10—40 tons/ac), and failure events (feedstock shortfalls, price drops) — all of which can swing the annual net by +/-$1M/yr. Regional treatment costs are the biggest wildcard: the western-US averages used here (~$500/ac, $21—28/ton) sit at the low end of the observed range, while California-specific costs (mechanical thin $1,742/ac, hand thin $1,088/ac, commercial-thin timber $59.43/GT Delyser et al., 2025) would roughly double-to-triple feedstock cost and wipe out any margin — so local figures must be re-run before committing Delyser et al., 2025.
Time frame. Even if approved, a 1-mill-every-3-yr ramp reaches full 3-MMBF capacity only in year 7 (mills at t=0, t+3, t+6) and requires sustained thinning throughout the ramp before feedstock stockpiles stabilize.
- Salafsky, N., Suresh, V., Bierbaum, R., Clarke, E., Smith, M., Whaley, C., & Margoluis, R. (2021). Taking Nature-Based Solutions Programs to Scale. FOS, STAP, GBMF. https://stapgef.org/sites/default/files/2021-06/Taking%20Nature%20Based%20Solutions%20to%20Scale%202021-01.pdf
- Lawler, J. (2025). How Much Does a Sawmill Cost? https://toolboxadvice.com/how-much-does-a-sawmill-cost/
- EquipmentFinancingHQ. (2026). How Much Does a Sawmill Cost? EquipmentFinancingHQ. https://equipmentfinancinghq.com/cost/sawmill/
- of Tennessee Extension, U. (2023). Estimating Weight of Logs and Standing Timber. University of Tennessee Institute of Agriculture. https://utia.tennessee.edu/publications/wp-content/uploads/sites/269/2023/10/SP748.pdf
- Service, U. F. (2008). Small-Diameter Success Stories III. USDA Forest Service, Forest Products Laboratory. https://www.fpl.fs.usda.gov/documnts/fpmu/sd_success_stories.pdf
- Forestnet. (2025). A Smooth Sawmill Start-Up. Forestnet. https://forestnet.com/a-smooth-sawmill-start-up/
- ZipRecruiter. (2026). Sawmill Worker Salary. ZipRecruiter. https://www.ziprecruiter.com/Salaries/Sawmill-Worker-Salary
- ERI. (2026). Sawmill Worker Salary in the United States. ERI Economic Research Institute. https://www.salaryexpert.com/salary/job/sawmill-worker/united-states
- Salary.com. (2025). Sawmill Worker Salary in the United States. https://www.salary.com/research/salary/hiring/sawmill-worker-salary
- Chang, H. (2023). The Cost of Forest Thinning Operations in the Western United States. In Journal of Forestry 121(2). https://academic.oup.com/jof/article/121/2/193/6901967
- Mitchell, D. (2009). Costs of Mechanical Fuel Reduction Treatments. USDA Forest Service, Southern Research Station. https://www.srs.fs.usda.gov/pubs/ja/2019/ja_2019_mitchell_003.pdf
- Delyser, K., Tase, N., Clay, K., Magnan, M., Evans, S., Keithley, C., Bartowitz, K., Gadoth-Goodman, D., Papa, C., Ontl, T., & Cooper, L. (2025). Effects of Forest Management & Wood Utilization on Carbon Sequestration & Storage in California. CAL FIRE. https://d3f9k0n15ckvhe.cloudfront.net/wp-content/uploads/2025/02/CBM_CA_report_FINAL.pdf
- Woodpreneur. (2021). Economics of Small Scale Mill Operations. Woodpreneur. https://woodpreneur.com/articles/economics-of-small-scale-mill-operations-production-costs/
- BLS. (2024). Logging Equipment Operators. U.S. Bureau of Labor Statistics. https://www.bls.gov/oes/