Abstract
Wildfire risk is high across much of California, but not all landscapes are equally vulnerable, and not all interventions produce equal benefits. Donut hole patterns, areas where fire has not occurred recently despite being surrounded by large fires, point toward where intervention matters most rather than simply restating that risk is high everywhere. By comparing crown fire probability with mechanical treatment feasibility in the four-county Central Sierra, we found only an 8% overlap, and 19% in the Shasta-Trinity Cascades. The most vulnerable areas are often steep, remote land that is difficult to reach through conventional thinning. Interagency Tracking System data show that recent treatments in Shasta and Trinity Counties concentrate less on high-probability acres than those in the Central Sierra, though the coarse resolution of the tracking polygons limits how finely that pattern can be interpreted.
These findings suggest that wildfire resilience may depend less on treating every acre and more on identifying high-leverage locations where intervention can alter outcomes across much larger portions of a firescape. They support a systems-based approach that treats mechanical thinning, cultural burning, prescribed fire, home hardening, and community planning as interconnected parts of a single strategy, reframing wildfire mitigation as a matter of prioritization rather than universal coverage.
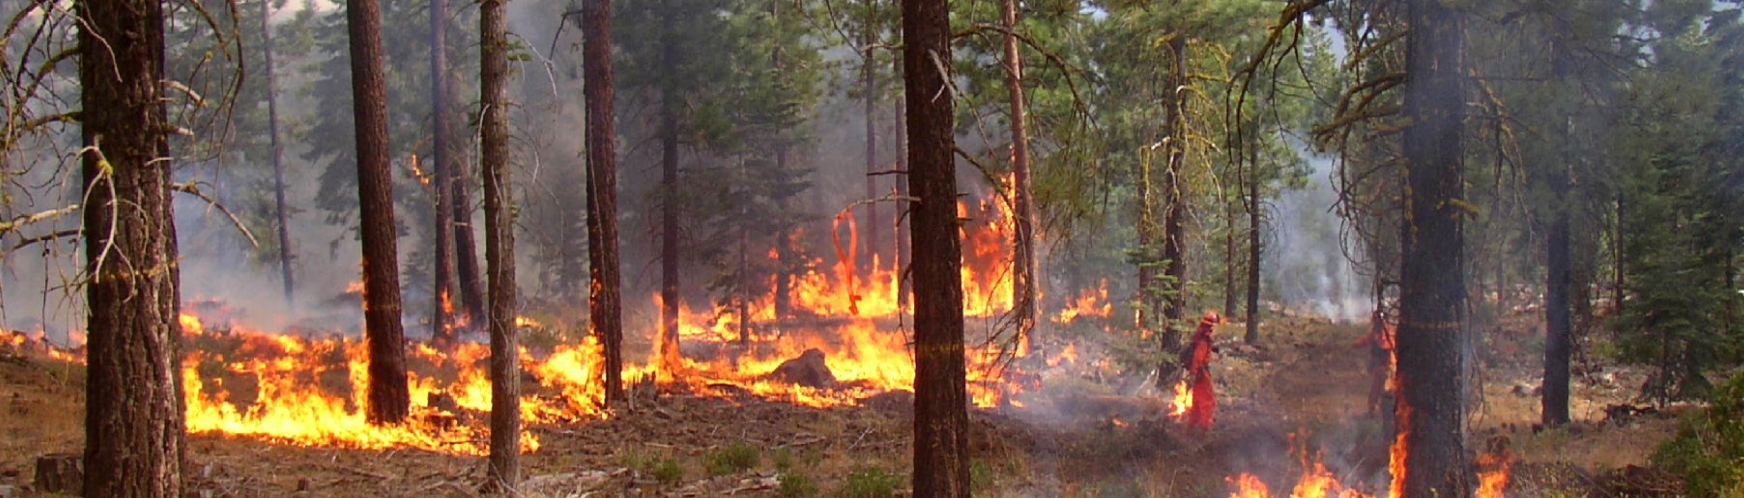
Figure 1:Prescribed fire in the Sierra Nevada.
Take-aways
Donut hole patterns reveal high-impact intervention zones. Areas that haven’t burned recently, even though they are surrounded by large fires, highlight landscapes where strategic action could bring significant benefits. This shifts the question from “where is risk highest?” to “where can intervention make the biggest difference?”
Strategic placement matters more than coverage. Only 8% of high crown-fire probability areas in the Central Sierra overlap with mechanically treatable land. Treating about 30% of a watershed in the right places can significantly change fire behavior across the broader system. Resilience comes from connectivity and placement, not universal treatment.
Mechanical treatment is a transition, not the final goal. Thinning restores conditions that allow good fire, prescribed fire, cultural burning, fire away from the WUI, to return safely (Figure 1). Forest treatment, home hardening, defensible space, and community planning work together as complementary layers of a single resilience system.
Background
“Nevada County [is] the next [big fire]. Everybody in wildland fire knows it. The ingress, egress, and the number of trees in that area. I don’t want to be there...I know people are going to die...” Bill Jacks WRCNC, 2026
Much public discussion about wildfire focuses on annual forecasts, drought conditions, and the prospect of another catastrophic season. Those concerns are real, but they can obscure a more practical question: where should limited resources be deployed to most effectively reduce future risk?
This is the second of two articles examining vulnerability and resilience across California firescapes. The first article identified two donut hole locations in the Sierra-Cascade region where large, destructive fires have not occurred recently, despite neighboring fire activity Russell, 2026. This article asks why those landscapes have remained unburned, whether that pattern reflects luck, resilience, or accumulated risk, and what it can teach us about where intervention can most effectively change outcomes.
The working premise is straightforward: the historical absence of fire, combined with elevated crown-fire probability and treatment context, identifies areas that are potentially vulnerable to severe fire under current conditions.
Methodology
We used the following geographic location, data, processing, and visualization methods for this study:
Study area
The study area comprised forested lands in Northern California, specifically focused on the four-county area in the Central Sierra of Nevada, Placer, Sierra, and Yuba Counties, and the two-county area in the Cascades of Shasta and Trinity Counties (Figure 2).
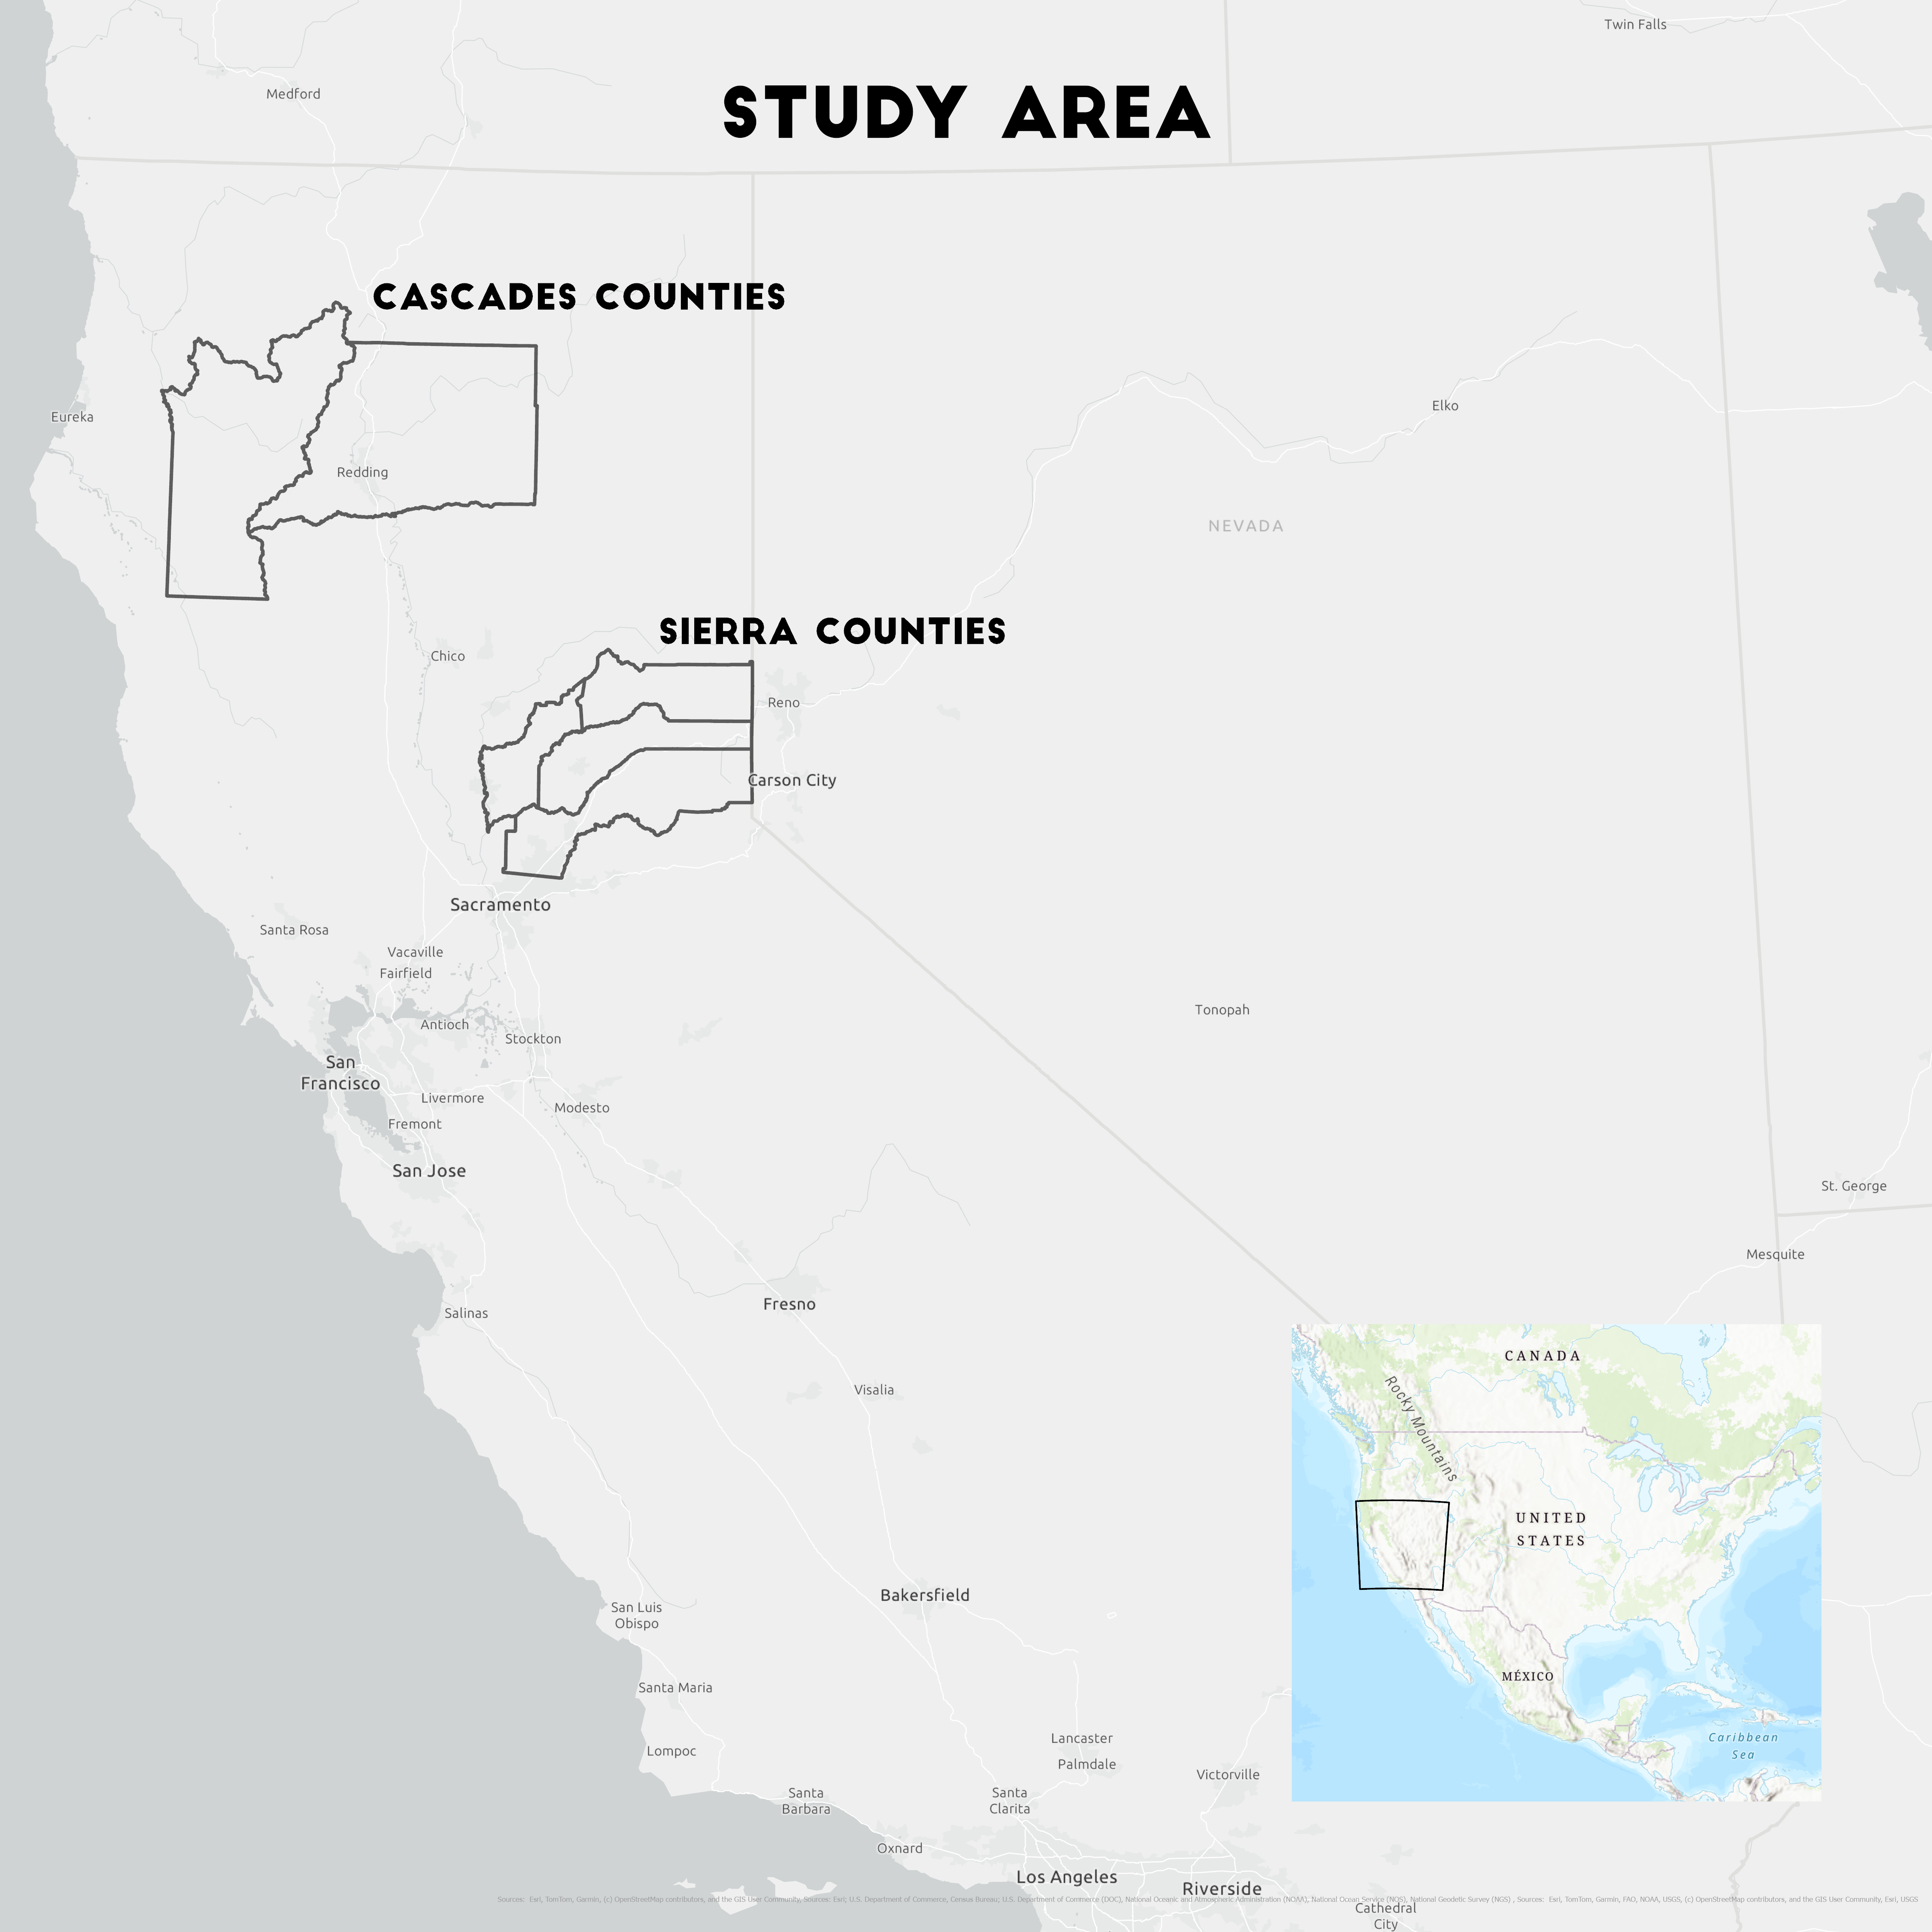
Figure 2:Study area in Northern California showing county boundaries used as delimiting borders.
Data & Processing
Datasets and processing are briefly summarized in Table 1. The Shasta-Trinity region lacked a mechanical treatment feasibility dataset, so we created one using the methodology developed by Tukman (2022). However, the data sources differed slightly, as indicated in the table.
Table 1:Geospatial datasets, source, description, and processing.
| Dataset | Source | Description | Processing |
|---|---|---|---|
| Crown fire probability | Pyrologix (2025) | Crown fire probability from 0-1 | Median probability by 4000 ha bins |
| Wilderness areas | PAD-US (2026) | US protected areas database | Wilderness area = low feasibility |
| Slope | 3DEP (2026) | USGS 3D elevation program digital elevation model | Slope calculation and >40% slope = low feasibility |
| Vegetation | NLCD (2026) | National Land Cover Dataset | Forest & shrublands = feasible for treatment, all other land covers = low feasibility |
| Hydrology | NHD (2026) | National hydrography dataset | 100’ and 50’ buffers for perennial and intermittent streams = low feasibility |
| Roads | Caltrans (2026) | California all public roads network | Low feasibility = > 1000 ft from roads |
| Sierra mechanical treatments | USFS (2016) | Sierra Nevada mechanical treatment feasbility scenario A raster | Feasible treatment areas clipped to the Sierra |
| Treatments | WFRTF (2026) | Interagency tracking system | Clipped to Sierra study area |
Data was processed using a combination of Python, the Geospatial Data Abstraction Library (GDAL), and QGIS. Crown fire probability is the median probability across transverse hexagons of 4,000 hectares (9,884 acres) in size from the Pyrologix (2025) dataset. We calculated the overlap between crown fire probability Pyrologix, 2025 and mechanical treatment feasibility for the four-county Central Sierra USFS, 2016, defining feasibility as slopes under 35% and within 1,000 feet (just over 300 meters) of an existing road. In the Shasta-Trinity region, we used a slightly higher slope threshold of 40%.
Visualization
Map graphics were developed using ArcGIS Pro layouts and exported to png’s. Graphics and rendering were done through mystmd.org executable book software.
Donut Holes, Islands, & Resilience
The donut hole pattern (Figure 3) is useful because it raises a question that hazard mapping alone cannot answer: are these landscapes functionally resilient, or simply overdue for a major fire? The answer determines whether they should be interpreted as examples of successful adaptation or as concentrations of accumulated risk.
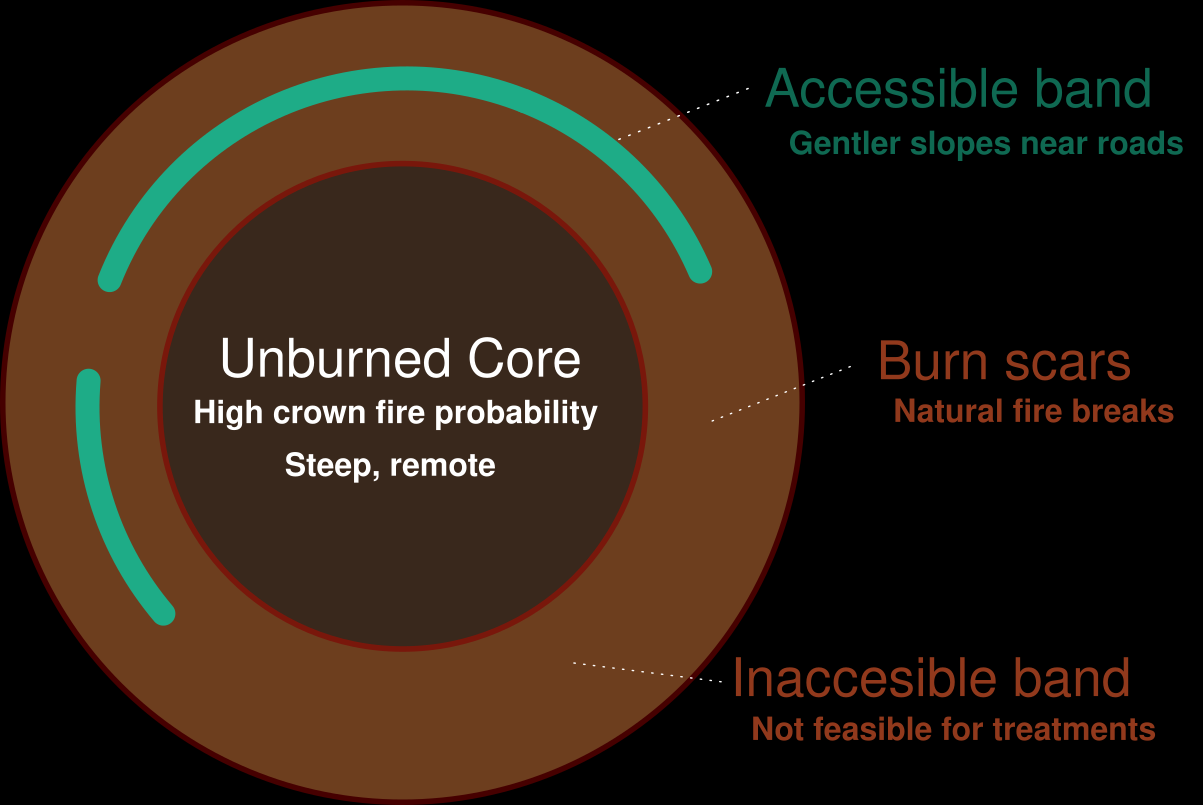
Figure 3:Donut hole conceptual model: a schematic of where treatment has the most leverage.
Recent work by Wilson et al. (2026) describes similar patterns as islands within larger fire landscapes. These islands offer opportunities to scale treatment across broader areas because surrounding burn scars have already established portions of the control network that would otherwise need to be built through future treatment or suppression. In that sense, the fires themselves can function as treatments Shive et al., 2025.
At the same time, the absence of recent fire does not imply safety. In a fire-adapted landscape, a long interval without fire can itself become a marker of vulnerability.
The point raised in Russell (2026) about fragmented treatment of private parcels in the wildland-urban interface applies here as well. There is a real herd-immunity logic to fire hardening and landscape stewardship. The shift this enables is from generalized narratives about bad fire years toward identifying specific areas of vulnerability through the overlap of fire-history gaps and crown-fire probability.
The significance of these landscapes lies not simply in whether they burn next year. Their importance is what they reveal about leverage within a fire-adapted system. Some areas appear capable of influencing outcomes far beyond their boundaries because they sit at the intersection of fire history, fuels, topography, ownership patterns, and community exposure. Identifying those leverage points shifts the goal from maximizing treatment everywhere to strategically shaping the places where intervention can create the greatest landscape-scale effect.
One possible explanation is that the Central Sierra has escaped major fire because of unusually low winds. We tested that hypothesis against a global wind dataset and found no anomaly that stood out Davis et al., 2023. Local-scale effects may still be operating, but we found no evidence that wind alone explains the persistence of these islands.
Hazard Mapping to Resilience Mapping
Traditional wildfire analysis asks where risk is highest. A resilience framework asks where intervention produces the greatest landscape-scale effect. The distinction may seem subtle, but it fundamentally changes the objective of management. Rather than attempting to treat every acre, managers may gain more by identifying strategically connected locations that influence fire behavior across far larger areas.
The 2014 Mokelumne Watershed Avoided Cost Analysis points in exactly this direction, showing that treatment need not be uniform to deliver benefits across a wider system Buckley et al., 2014. The study modeled that treating roughly 30% of a watershed in strategically connected areas could significantly alter fire behavior across the broader system.
What matters is not the precise figure but the principle it implies: resilience can emerge through connectivity and placement rather than complete coverage. This helps explain why some landscapes may matter disproportionately. Strategic placement, connectivity, and stewardship can create effects extending well beyond the boundaries of individual projects. The challenge is therefore not simply one of scale, but of placement.
The herd immunity metaphor is useful here, not because fire behaves like disease, but because both systems exhibit threshold effects. If enough of a landscape is treated, connected, and stewarded appropriately, the probability of catastrophic crown fire can decline significantly even though many individual acres remain untreated. Wildfire resilience, in this view, depends less on maximizing treated acreage than on locating high-leverage interventions that shift broader patterns of fire behavior.
Feasible Treatment Areas
We calculated the overlap between crown fire probability and mechanical treatment feasibility for the four-county Central Sierra and Cascade region, which is shown in Figure 4. In the Shasta-Trinity region, the resulting feasibility map showed 19% overlap with high crown fire probability (over 70%).
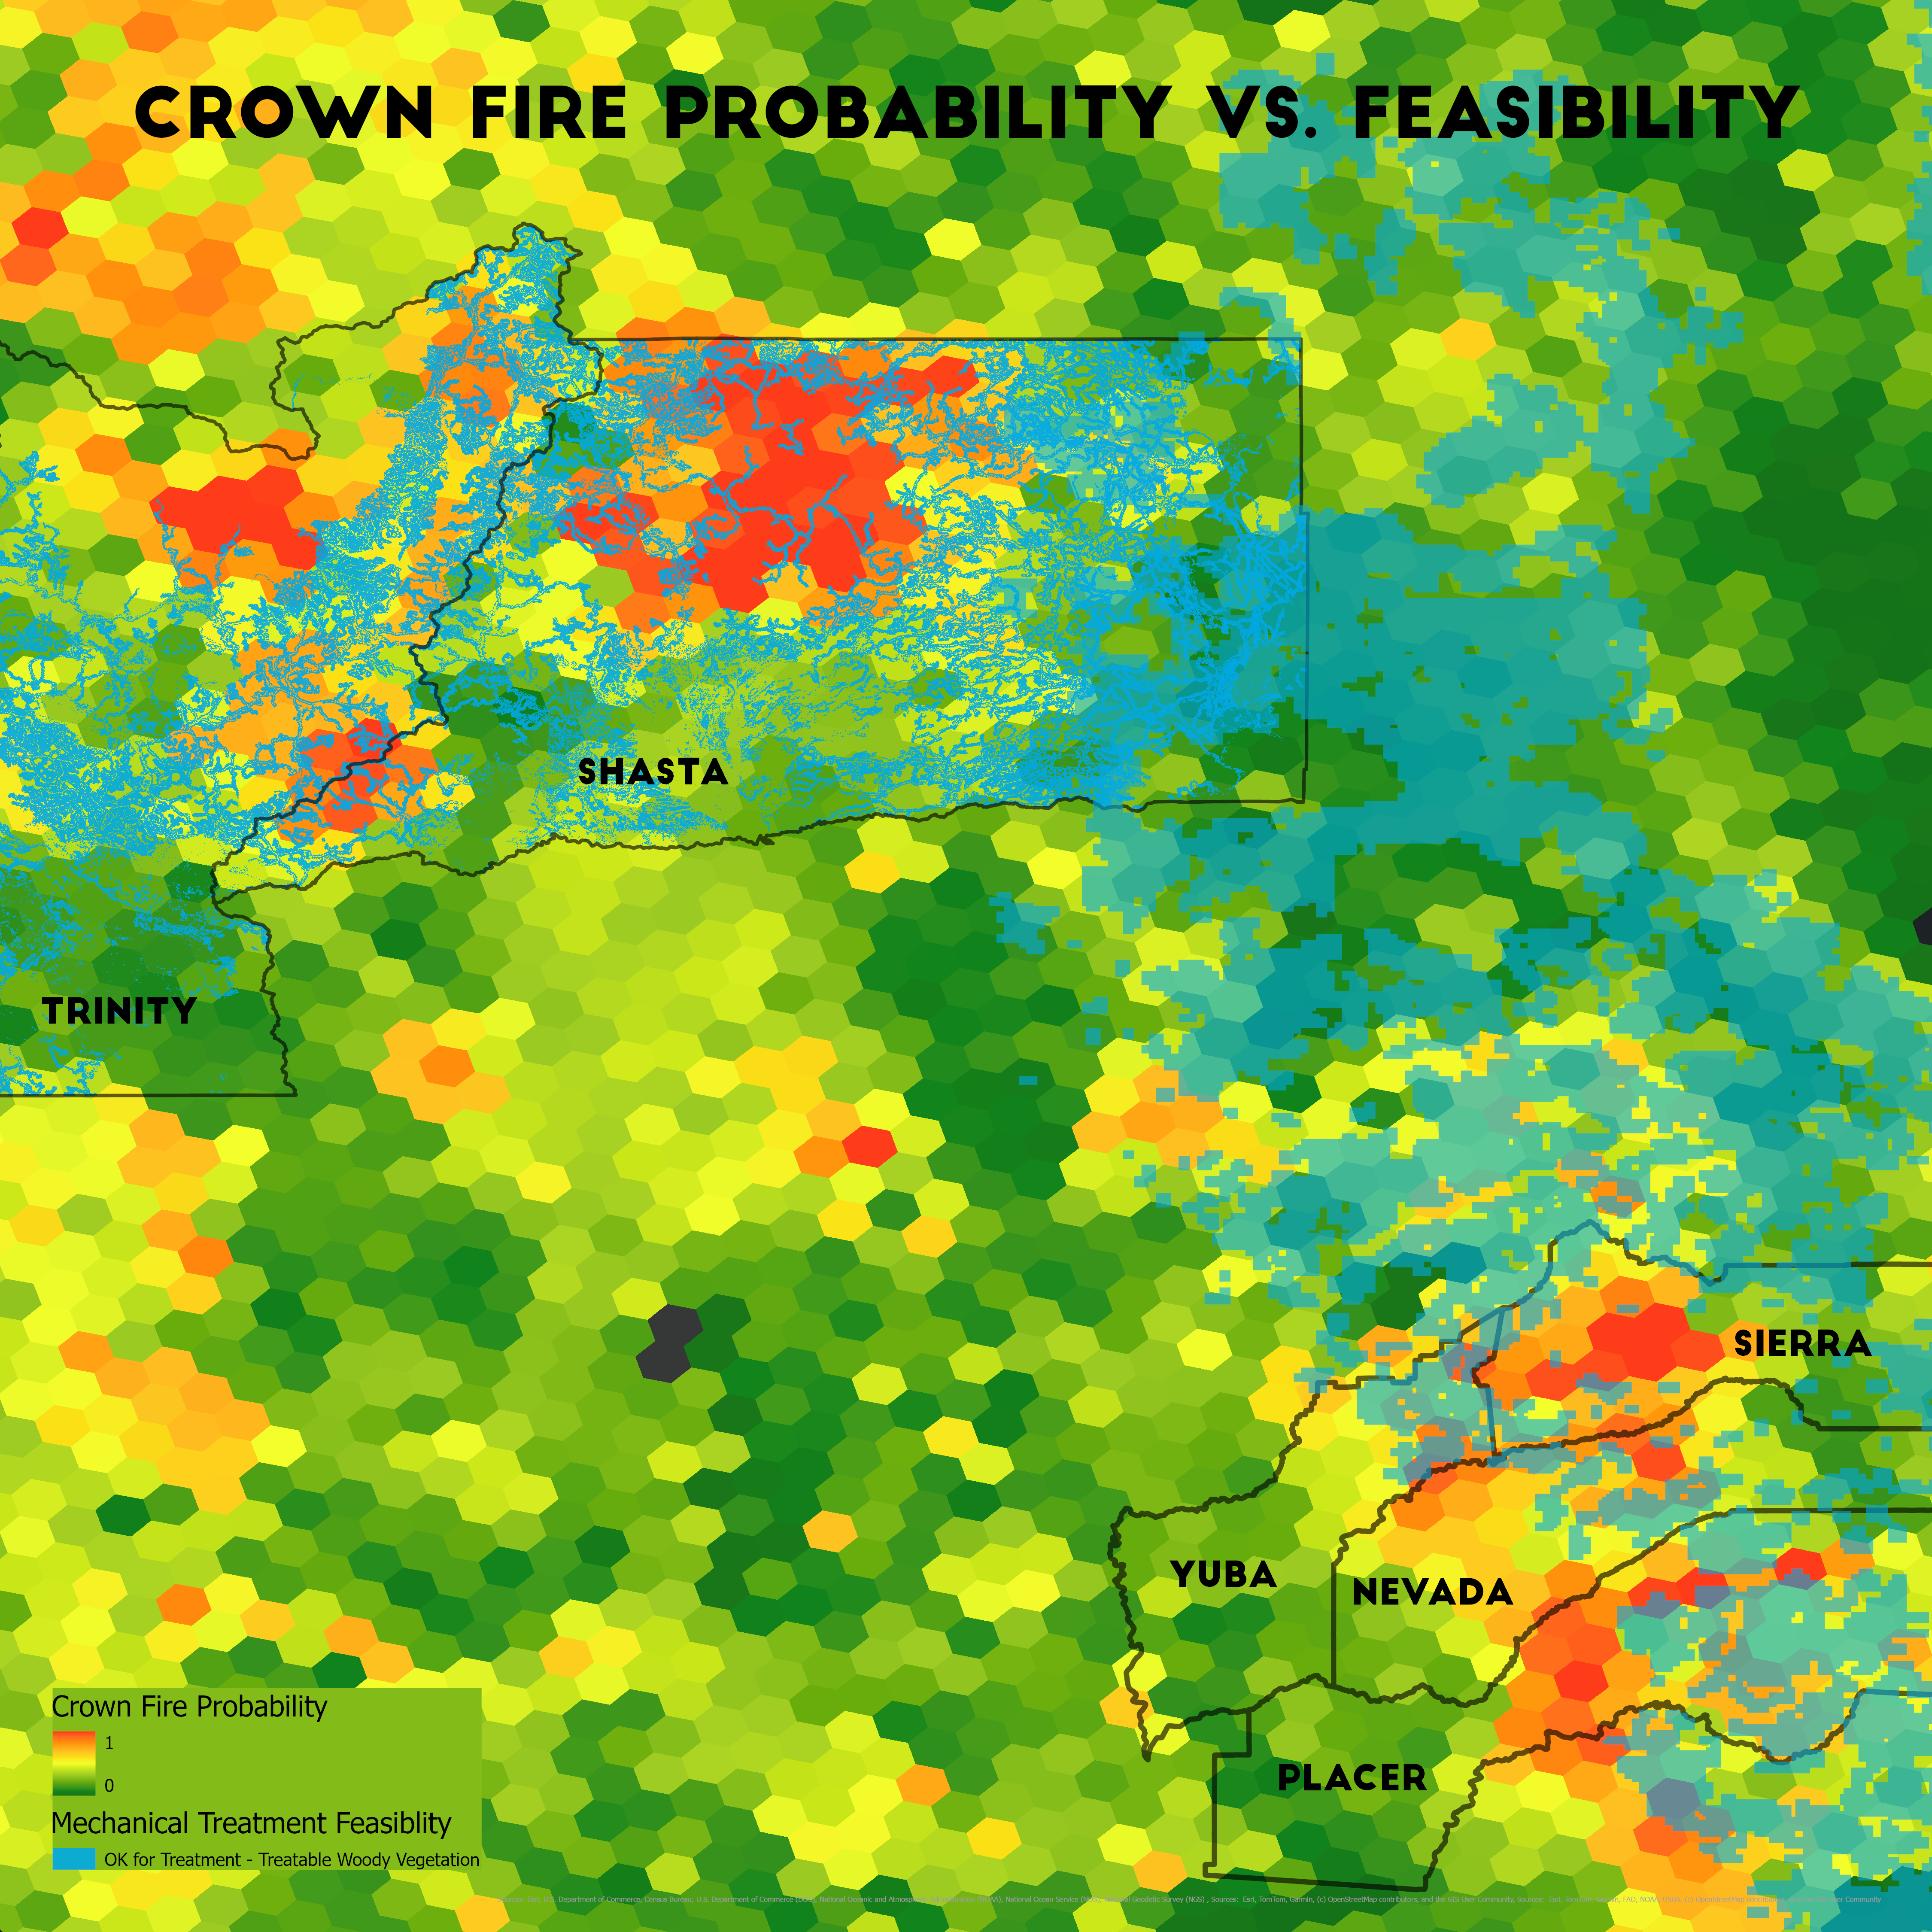
Figure 4:Crown fire probability vs. mechanical treatment feasibility (<35% slopes and within 1000’, just over 300m, of existing roads>). The calculated overlap between the two datasets is 8% in the Sierra and 19% in the Cascades.
Only 8% of feasible-to-treat land in the Central Sierra overlapped with high crown fire probability. The most vulnerable areas, those with the highest probability of crown fire, tend to sit on steeper, more remote slopes that conventional mechanical treatment cannot easily reach. That is alarming from a treatment standpoint, but the same inaccessibility may also make those areas less prone to human-caused ignition. The finding does not argue against treatment. It argues for directing accessible treatment to the areas that prevent fire from reaching high-probability ground.
Recorded Treatments
The Interagency Tracking System tells a complementary story (Figure 5). Recorded treatments do overlap with high-probability areas, though the data must be read with care: the tracking polygons are large, on the order of 10,000 acres, and each probability value represents the median across an entire polygon. At that resolution, even a small, well-placed treatment can appear to cover a large landscape, and fine-grained claims about targeting should be made cautiously.
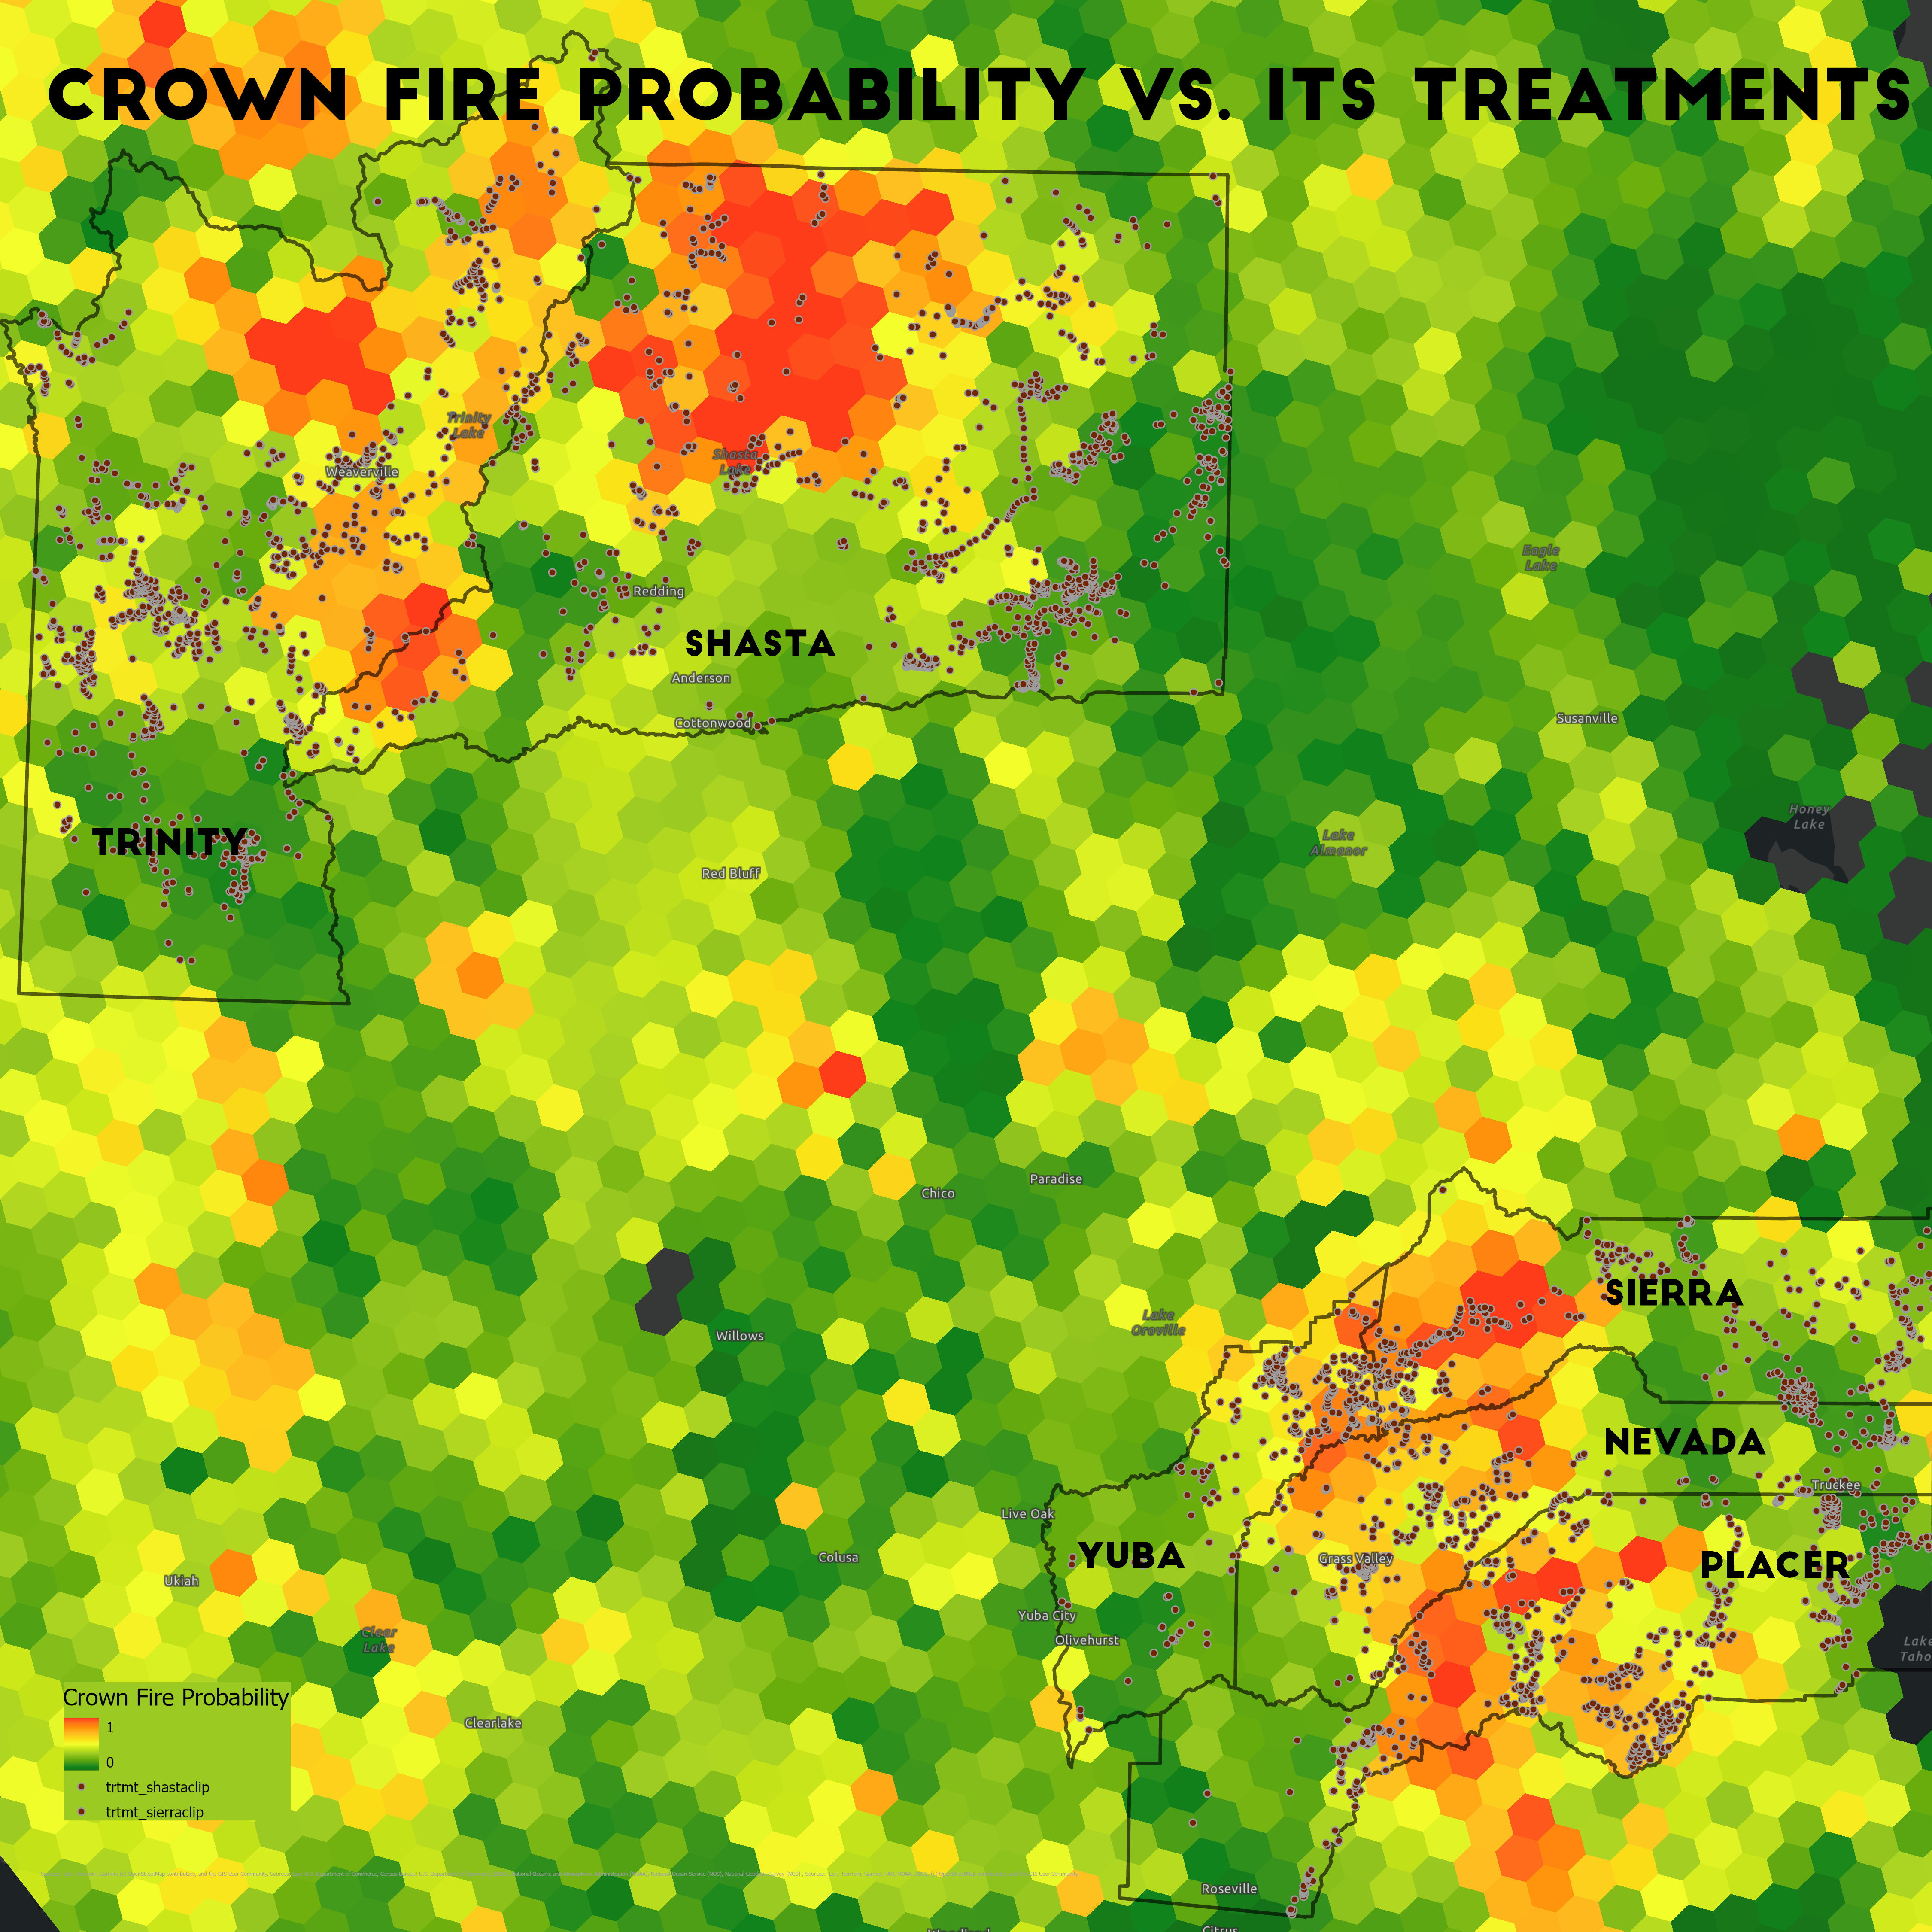
Figure 5:Crown fire probability vs. Interagency Tracking System treatments. There are more treatments in the Central Sierra high-probability areas than in the donut in the Cascades.
With that caveat in mind, the binned distributions still show a difference in emphasis between the two regions. Treatments in Shasta and Trinity Counties skew toward lower-probability acres (Figure 6), while the Central Sierra carries a larger share in higher-probability zones (Figure 7).
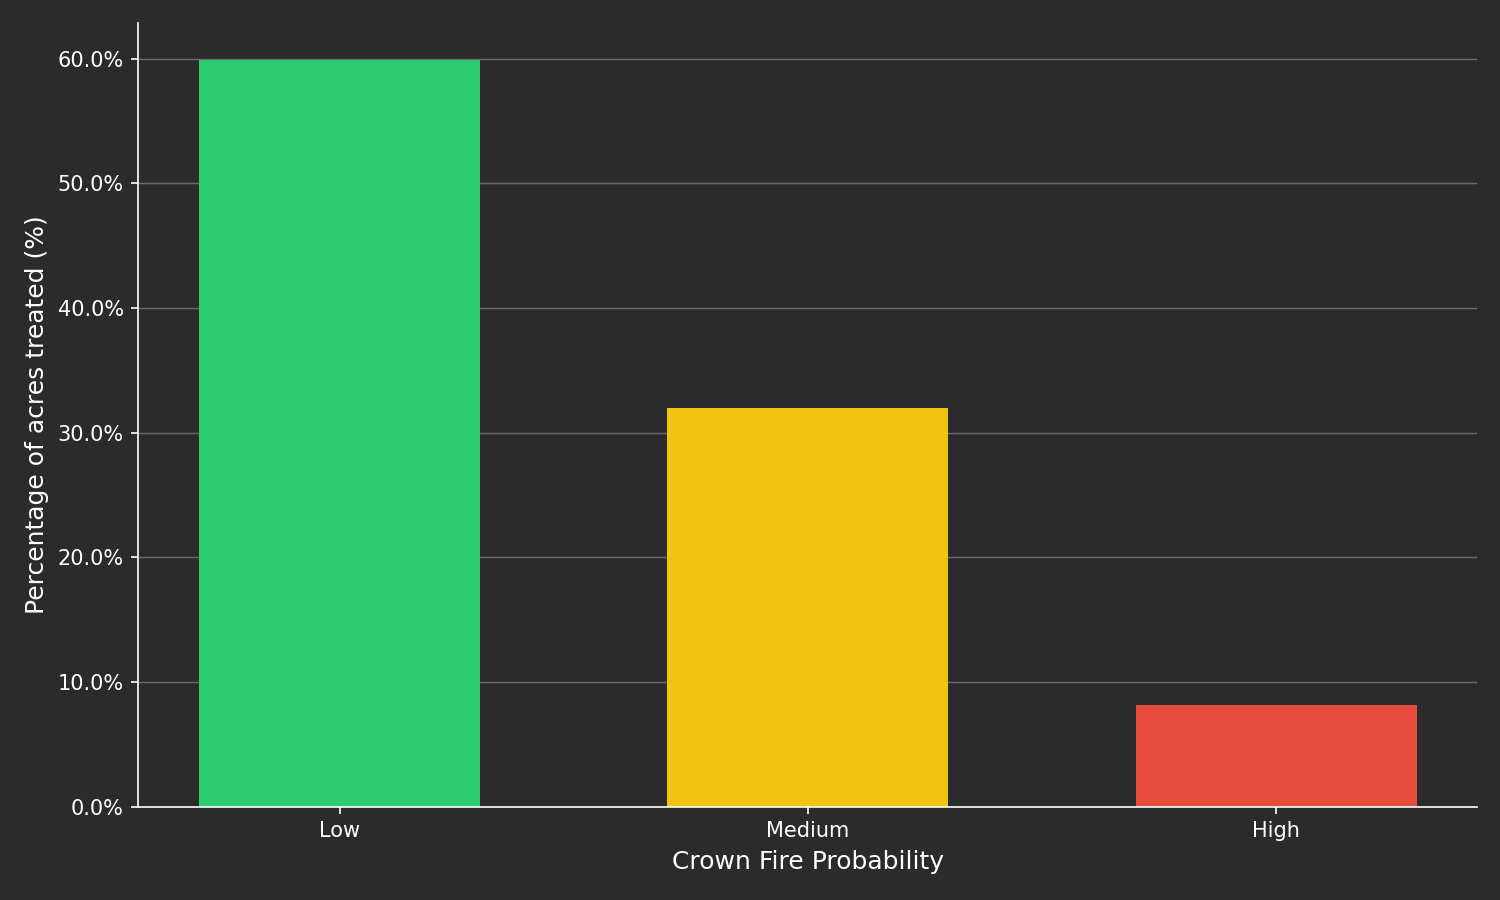
Figure 6:Crown fire probability vs. percent area treated in Shasta and Trinity Counties. Low 60%, Medium 32%, High 8%.
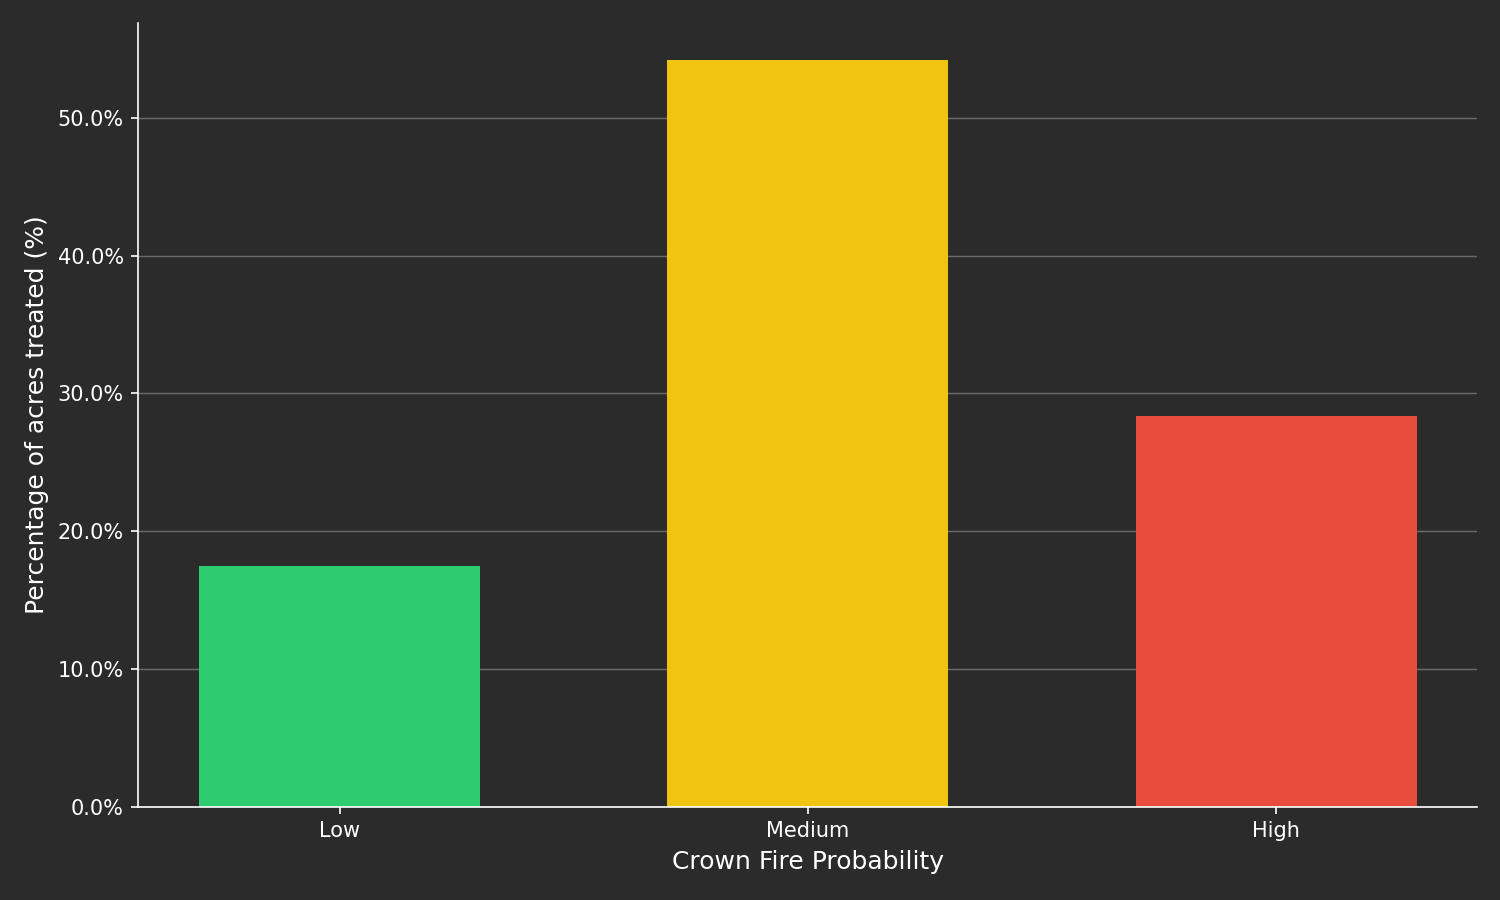
Figure 7:Crown fire probability vs. percent area treated in Central Sierra Counties. Low 18%, Medium 54%, High 28%.
Mechanical Treatment as Transition
These findings carry an implication beyond prioritization. For more than a century, fire suppression allowed fuels to accumulate across much of California’s forests, leaving many landscapes with far higher fuel loads and tree densities than existed under historic fire regimes.
Mechanical treatment is often necessary to bring those conditions back to a point where fire can safely return. It is not the destination. The purpose of treatment is ultimately to bring good fire back into the system.
California’s forests were historically maintained by frequent fire, much of it deliberately applied by Indigenous peoples through cultural burning. Those practices produced patchy forests, open meadows, varied age structures, and lower-intensity fire behavior. Thinning is a transitional intervention that helps restore the conditions under which prescribed fire, cultural burning, and naturally occurring fire can once again maintain forests within a more resilient range of behavior.
Layered Resilience
The same systems logic extends to communities. Forest tending and home hardening are often discussed separately, but they function as complementary forms of resilience infrastructure. Forest treatment, home hardening, defensible space, evacuation planning, and community preparedness are usually treated as separate policies. In practice, they operate as interacting layers within a larger resilience system. A treated forest surrounding vulnerable communities behaves differently from an untreated one. Hardened homes perform differently in landscapes that burn at lower intensity. Neither intervention is sufficient on its own. Together, they create overlapping layers of protection, and their interaction may matter as much as any individual measure.
Applications
Donut hole patterns offer a practical way to identify where intervention may matter most. Rather than treating wildfire risk as uniformly distributed, they help reveal landscapes where strategic action could produce disproportionate benefits. Surrounding burn scars may function as ready-made control features, while crown-fire probability, treatment feasibility, ownership patterns, and community exposure provide additional clues about where resources can have the greatest effect.
In the Central Sierra, only 8% of high crown-fire probability overlaps with mechanically treatable land, meaning the places most at risk are often the hardest to reach. That makes strategic prioritization more important, not less.
Combining fire history, crown-fire probability, treatment feasibility, ownership patterns, cultural burning opportunity, and community exposure moves wildfire planning from hazard mapping toward resilience planning Figure 8. The future of mitigation may depend less on treating everything than on understanding where relatively small interventions can create disproportionately large benefits across an entire firescape. Resilience emerges not simply from the number of acres treated, but from how treatments, stewardship practices, communities, and fire itself are connected across the landscape.
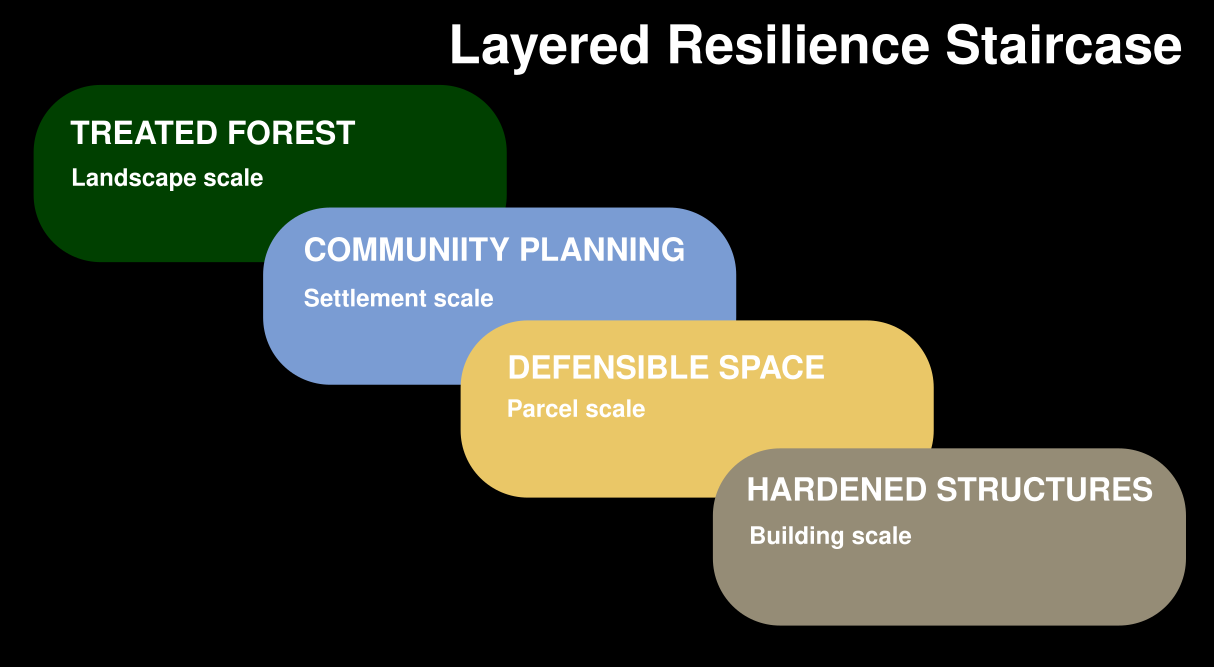
Figure 8:Layered resilience as a descending staircase where each step from landscape to building scale rests on the previous layer. The overlapping layers reinforce one another, and no single treatment layer is sufficient to mitigate wildfire. A treated forest changes how a fire arrives; a hardened home changes what happens when it does. Community planning and defensible space connect the two. Protection comes from the overlapping scales, where one layer covers what another cannot. Any gaps in coverage let the fire through.
Ultimately, the goal is not treatment for its own sake. It is to restore landscapes capable of supporting good fire, allowing prescribed fire, cultural burning, and naturally occurring fire to resume their historic role in maintaining healthy, resilient forests.
- WRCNC. (2026). Standing Dead: Overstocked, Overgrown, Overdue. Wildfire Ready Coalition of Nevada County & Riparian Studios. https://www.youtube.com/watch?app=desktop&v=ri5NJbvwiwo
- Russell, V. (2026). Predicting 2026 wildfires. https://3point.xyz/predicting_fire2/
- Tukman, M. (2022). North Coast Mechanical Treatment Feasibility. Tukman Geospatial. https://ncrp.maps.arcgis.com/home/item.html?id=b72b2ea500c84c12a2f84a620336280e
- Pyrologix. (2025). Crown fire probability. https://www.vpdatacommons.org/datasets/crown-fire-probability
- PAD-US. (2026). Protected Areas Database of the United States. https://www.usgs.gov/programs/gap-analysis-project/science/pad-us-data-download
- 3DEP. (2026). 3D elevation program. https://www.usgs.gov/3d-elevation-program
- NLCD. (2026). National Land Cover Database. https://www.usgs.gov/centers/eros/science/national-land-cover-database
- NHD. (2026). National Hydrography Dataset. https://www.usgs.gov/national-hydrography/national-hydrography-dataset
- Caltrans. (2026). California all public roads network. https://gisdata-caltrans.opendata.arcgis.com/datasets/2d56e65de89c418780056651640291e8_0/about
- USFS. (2016). USFS mechanical treatment opportunity (scenario a). https://gisday23.maps.arcgis.com/home/item.html?id=e6b29bd66c6a4214b11aaff5af5cd6c9
- WFRTF. (2026). California Wildfire & Landscape Resilience Interagency Treatments. https://portal.sparcal.sdsc.edu/arcgis/home/item.html?id=510f66aeca6f4244b2cee79ed970aaa3
- Wilson, K. N., Shive, K. L., Williams, J. N., North, M. P., Coppoletta, M., Hendershot, J. N., & Stanley, C. K. (2026). Perspectives: The pace and scale challenge: Leveraging wildfire footprints to increase forest resilience to future high-severity fire. Forest Ecology and Management, 603, 123443. https://www.sciencedirect.com/science/article/pii/S037811272500951X
- Shive, K. L., Knight, C. A., Steel, Z. L., Stanley, C. K., & Wilson, K. N. (2025). Leveraging wildfire to augment forest management and amplify forest resilience. Ecosphere, 16(6). https://doi.org/10.1002/ecs2.70306
- Davis, N., Badger, J., Hahman, A., Hansen, B., Mortensen, G., Kelly, M., Larsen, X., Olsen, B., Floors, R., & others. (2023). The Global Wind Atlas: A high-resolution dataset of climatologies and associated web-based application. https://doi.org/10.1175/BAMS-D-21-0075.1
- Buckley, M., Beck, N., Bowden, P., Miller, M., Hill, B., Luce, C., Elliot, W., Enstice, N., Podolak, K., Winford, E., & others. (2014). Mokelumne watershed avoided cost analysis: why Sierra fuel treatments make economic sense. https://sierranevada.ca.gov/what-we-do/mokelumne-watershed-avoided-cost-analysis