Abstract
This chapter explores fuel reduction needs to decrease risks of severe wildfire for private forest owners in low-income communities in California. The spatial analysis combines poverty data, land ownership, and landscape treatment needs at the census and county levels.
Our findings show that of California’s 6.7 million acres of private forest land that need fuel treatment, 4.0 million acres are within high-poverty counties (where poverty rates exceed 20%), and 1.6 million acres are within extreme poverty counties (where poverty rates exceed 40%). Nearly one-quarter of total private forest wildfire treatment needs fall within counties with extreme poverty. Three counties comprise approximately half of the treatment needs in extreme poverty areas: Mendocino, Humboldt, and Tehama. While these counties require 822,000 acres of treatment, only 8,658 acres were treated in 2022, a rate that would take 95 years to meet the total treatment needs.
This research highlights areas where additional resources may be essential to meet California’s dual forest management and community resilience objectives. Future research extensions include mapping anticipated funding allocations to high treatment-need and low-income communities, exploring the holistic benefits of wildfire reduction treatments on low-income communities, and collecting granular, parcel-level private landowner information to further inform treatment prioritization.
Veenu King and Michael Kent | New Leaf Climate Partners
Wildfire
California’s diverse landscapes encompass forests, grasslands, chaparral, and urban-wildland interfaces, each playing a critical role in the state’s ecological and economic vitality. Its 33 million acres of forests span the Coast, Cascade, and Sierra Nevada ranges. Ownership is mixed across public and private, with 60% of forestland publicly owned—mostly National Forests followed by State and BLM lands USDA (2024). The remaining forest lands are split between private industrial and private non-industrial. The bulk of California forests are made up of mixed conifers—dominated by douglas-fir, giant sequoia, Jeffrey pine, pinyon, and ponderosa pine—followed by western oak woodlands CFF (2024).
These forests are fire-adapted. While wildfires are a natural element of California’s forests, human activities, land use changes, fire suppression practices, and climate change have intensified the frequency and severity of wildfires (Figure 1).
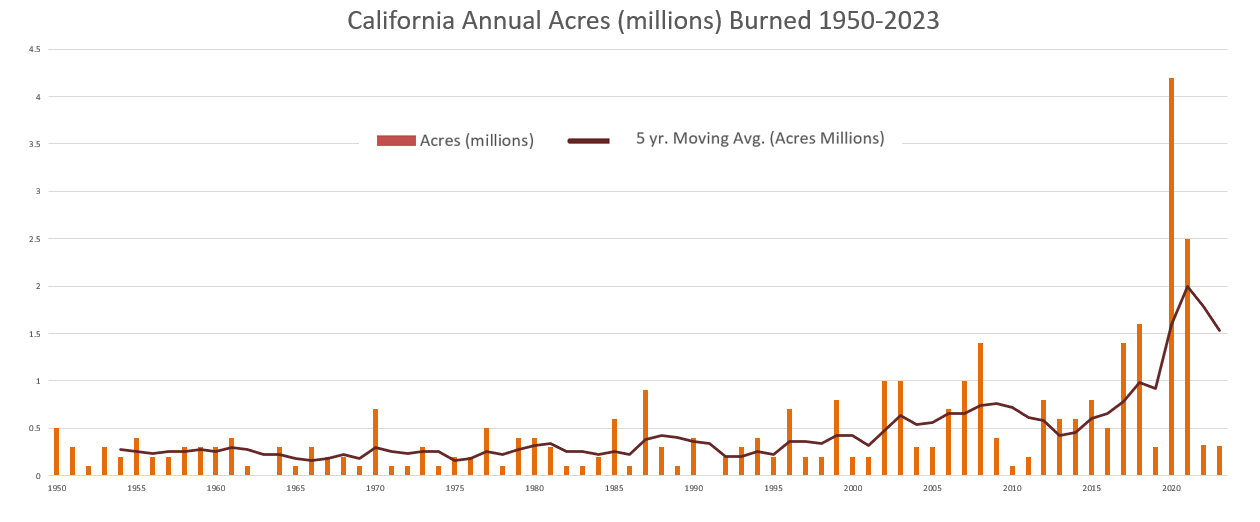
Figure 1:Annual acres burned statewide. Source: California Environmental Protection Agency’s Office of Environmental Health Hazard Assessment OEHHA (2024).
In 2023, California experienced over 4,500 wildfires that burned through 116,399 acres. Midway through the 2024 wildfire season, the state has already experienced 5,383 wildfires burning through 827,880 acres FIRE (2024). This trend has shown no signs of slowing, with experts warning that the region has entered an era of megafires OEHHA (2024).
Disparities
California’s megafires significantly destroy homes, infrastructure, and natural habitats, leading to loss of life, displacement, and billions of dollars in damages. They worsen air pollution, degrade water quality, and release large amounts of carbon dioxide, exacerbating climate change.
These impacts disproportionately affect low-income and Indigenous communities. Studies have examined the relationship between fire hazard [1], fire experience, and income in California communities, showing that communities experiencing higher fire frequency have lower incomes (Figure 2). This result could be due to the lack of investment and resources in those areas or the repeated fires that have changed the communities over time.
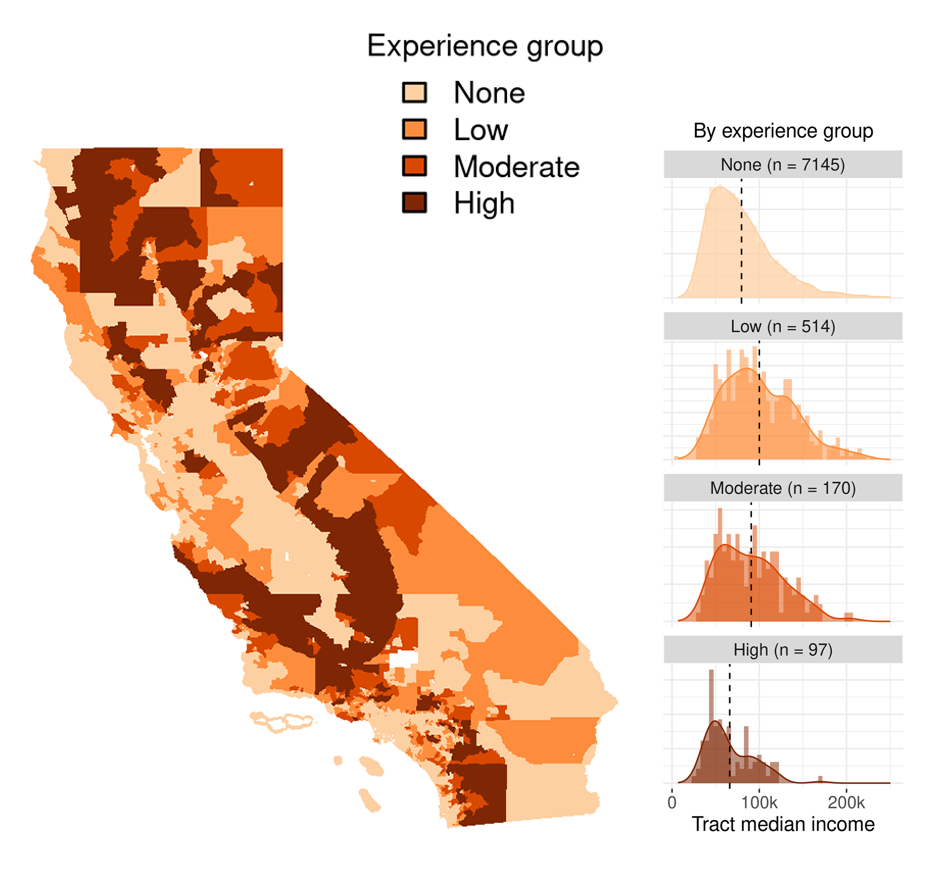
Figure 2:Fire experience by census tracts and corresponding median income by experience group. Source: Hino, Field: “Fire frequency and vulnerability in California.”
Additionally, this study’s analysis on fire suppression has found that communities with high property values stop the spread of wildfires, thus reducing their deleterious impact Hino & Field (2023). California’s low-income communities suffer repeated fires and subsequent health impacts from persistent air pollution as well as higher daily cardiovascular hospitalization Chen et al. (2024) Pohl (2024) Secaira (2023).
Treatments
California has identified more than 20 million acres that need fuel treatment across various landscape types to reduce hazardous vegetation. For this analysis, treatment needs are narrowed to private forest lands and privately owned forested areas with 20% or more canopy cover. Treatment for forests includes prescribed burning, selective harvesting and thinning, herbicide applications, and constructing fuel breaks. These interventions reduce fuels that generate catastrophic fire conditions and slow-burning fires, provide buffer zones to limit crown fires and return forest lands to a state that can support low-intensity fires. In collaboration with many federal, state, local, and non-government entities, the Forest Management Task Force published California’s Wildfire and Forest Resilience Action Plan, which aims to treat one million acres of state and federal land annually by 2025 WFRTF (2021).
Methods
This research focuses on the spatial overlap of wildfire treatment needs within private forests in low-income regions. QGIS was used to create spatial overlaps of different maps, including land ownership, poverty, treatment, and forest mapping datasets. Python was used for statistical analysis. Previous studies have examined the relationship between populations and past wildfires, but few have analyzed the forward-looking treatment needs at a census tract level Hatfield (2001) Shahir Masri et al. (2021).
Definitions
- Forest and Wildfire Fuel Treatment: Treatment includes prescribed burning, mechanical treatment, manual treatments, herbicide application, and prescribed herbivory to reduce hazardous vegetation, constructing fuel breaks, and ecological restoration Environmental (2024).
- Poverty Rate: California Environmental Protection Agency’s Office of Environmental Health Hazard Assessment defines this as the percent of the population living below two times the federal poverty level from a 5-year estimate for 2015-2019 PPIC (2024).
- Poverty Population Threshold: High Poverty 20%; Extreme Poverty 40%. The USDA defines areas of “high poverty” as those with a poverty rate of 20%+ and “extreme poverty” as those with a poverty rate of 40%+ USDA (2023).
Datasets
The following datasets were used for the study:
- Land Ownership Dataset: CAL FIRE’s California Land Ownership dataset and the California Census Tract Dataset identify public lands.
- Forest Dataset: the 2021 National Land Cover Database USGS (2018). It is critical to note that the National Land Cover Database has identified three types of forests: Deciduous forests, evergreen forests, and mixed forests. To be labeled a forest, these regions’ trees must comprise more than 20% of the total vegetation cover. This definition of a forest differs from that of USDA’s Forest Inventory Analysis (FIA), which defines a forest as an area with at least 10% canopy cover and is for forestry use. As a result, the total acres of forest in California from FIA and NLCD are different, 19 million acres and 31 million acres, respectively. Additionally, in the NLCD dataset, there is no distinction between industrial private and non-industrial private forest lands.
- Forest and Wildfire Fuel Treatment Dataset: CAL Vegetation Treatment Program Environmental Impact Report and dataset California Vegetation Treatable Landscape
- Acres Treated Dataset: California Wildfire & Forest Resilience Task Force’s Beta Interagency Treatment Dashboard. Most of the information captured in this dashboard related to forest treatment activities was used to identify the number of forest acres treated. There were 93,000 acres of targeted grazing (of the total 751,467 acres treated); however, it was unclear if it was forest-related and was included nonetheless.
Key Findings
This research has identified several critical insights that underscore the complex relationship between wildfire treatment needs and economic vulnerability in California. It has also provided a way to identify high-impact opportunity areas where financial assistance might have a greater socio-economic and environmental impact. Key findings include
- More than 33% of the state’s wildfire treatment needs are on private forest land. Of the roughly 20 million acres of treatable lands across landscape types, 18 million acres are private lands; of that, 6.7 million acres are private forests (Figure 3).
- Of the 6.7 million private forest treatable acres, 4 million acres are concentrated in High Poverty Census Tracts. That is, 60% of total private treatment needs are concentrated in areas where the poverty rate exceeds 20%—2x the national average.
- Of the 6.7 million private forest treatable acres, over 1.6 million acres are concentrated in Extreme Poverty Census Tracts (Figure 3). About 25% of total private treatment needs are located in areas where the poverty rate exceeds 40%—4x the national average.
- Three of 58 counties make up half of treatable forests in Extreme Poverty Zones. Mendocino, Humboldt, and Tehama have nearly 822,000 acres of private forest in Extreme Poverty lands requiring fuel reduction.
- Current treatment levels are falling short. In 2022, 86,000 acres were treated on private lands. If California continues at this rate, addressing the total private forest need will take more than 75 years.
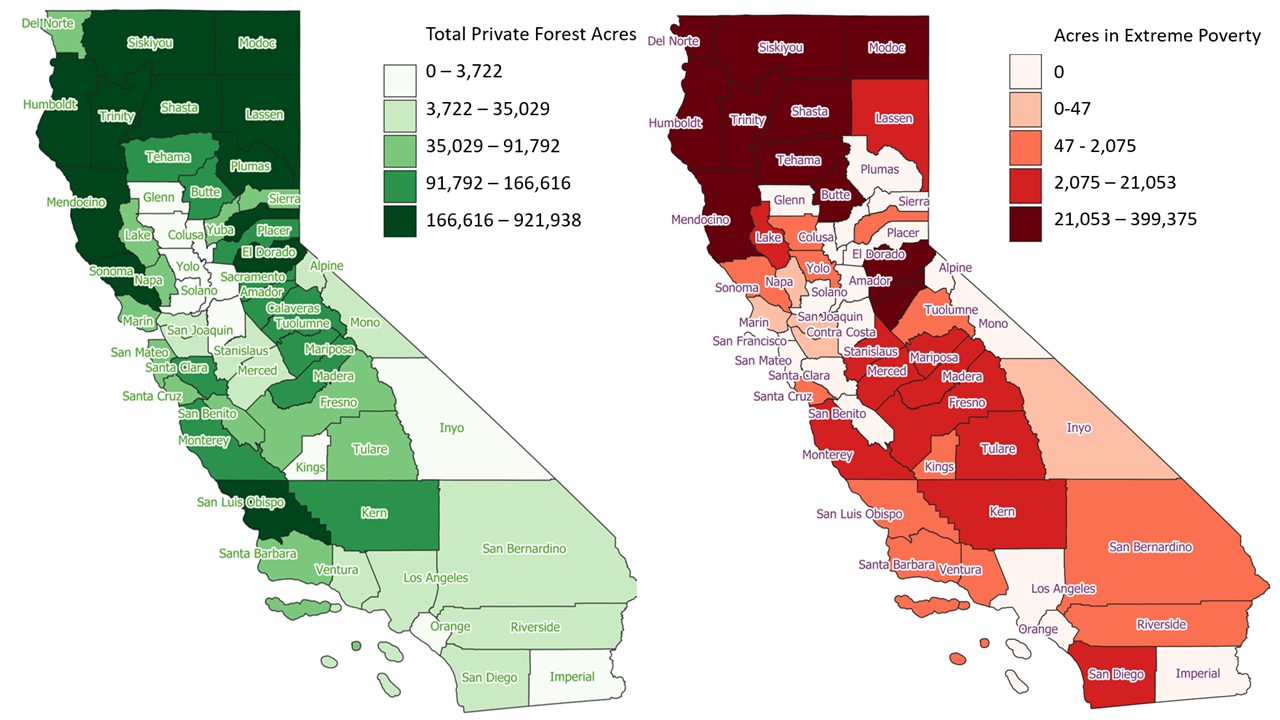
Figure 3:Private forest treatment needs by total acres within counties at left and private forest treatment needs by total acres within extreme poverty counties at right.
Top 5 counties with the greatest total acres of private treatable lands in extreme poverty (poverty rate > 40), their acres in high poverty (poverty rate > 20), and their acres treated in 2022 (Table 1).
Table 1: Top 5 counties with the greatest total acres of private treatable lands in extreme poverty (poverty rate > 40%), their acres in high poverty (poverty rate > 20%), and their acres treated in 2022.[2]
| County | Treatment Need (acres) | % High Poverty | % Extreme Poverty | Treated (acres) | % Treatment Gap |
|---|---|---|---|---|---|
| Mendocino | 690,543 | 100 | 58 | 714 | 99.9 |
| Humboldt | 921,938 | 100 | 28 | 1573 | 99.8 |
| Tehama | 165,836 | 100 | 100 | 6371 | 96.2 |
| Shasta | 556,829 | 100 | 29 | 7156 | 98.7 |
| Siskiyou | 523,573 | 100 | 22 | 4727 | 99.1 |
Next Steps
The challenges California’s diverse ecosystems face are compounded by the increasing frequency and intensity of wildfires driven by climate change. Low-income communities have been disproportionately affected by wildfires, experiencing higher health and economic burdens. This research confirms that low-income and underserved communities comprise most of California’s fuel treatment needs but treat landscapes at rates that would take decades, if not centuries, to complete.
California can better safeguard its natural landscapes and most vulnerable populations by aligning wildfire treatment strategies with socio-economic resilience measures. Future studies and policy developments should prioritize these high-risk, high-need areas to foster a more equitable and effective approach to wildfire management and climate adaptation. Future research can delve deeper into granular information on the different treatment types across geographies, gather parcel-level data, and explore permitting, planning, and aggregation issues to conduct larger-scale fuel treatments in the state.
Appendix
Table 2. Treatable privately owned acres in high and extreme poverty, total activity acres, and total activity acres on private land. [3]
| County | Treatment Need (acres) | % High Poverty | % Extreme Poverty | Treated (acres) | % Treatment Gap |
|---|---|---|---|---|---|
| Alameda | 31,109 | 0 | 0 | 129 | 99.6 |
| Alpine | 3,963 | 100 | 0 | 13 | 99.7 |
| Amador | 106,109 | 84 | 20 | 342 | 99.7 |
| Butte | 153,314 | 64 | 53 | 2400 | 98.4 |
| Calaveras | 141,309 | 96 | 47 | 2782 | 98.0 |
| Colusa | 696 | 100 | 66 | 1264 | 0.0 |
| Contra Costa | 15,563 | 1 | 0 | 0 | 100.0 |
| Del Norte | 83,019 | 100 | 48 | 0 | 100.0 |
| El Dorado | 281,940 | 71 | 15 | 1821 | 99.4 |
| Fresno | 89,896 | 53 | 11 | 2129 | 97.6 |
| Glenn | 526 | 0 | 0 | 163 | 69.1 |
| Humboldt | 921,938 | 100 | 28 | 1573 | 99.8 |
| Imperial | 0 | 0 | 0 | 377 | 0.0 |
| Inyo | 242 | 100 | 17 | 18 | 92.6 |
| Kern | 102,736 | 90 | 14 | 397 | 99.6 |
| Kings | 48 | 100 | 100 | 0 | 100.0 |
| Lake | 52,480 | 100 | 17 | 422 | 99.2 |
| Lassen | 284,718 | 100 | 1 | 5948 | 97.9 |
| Los Angeles | 5,289 | 31 | 0 | 0 | 100.0 |
| Madera | 120,475 | 100 | 11 | 739 | 99.4 |
| Marin | 36,009 | 6 | 0 | 249 | 99.3 |
| Mariposa | 116,805 | 100 | 17 | 585 | 99.5 |
| Mendocino | 690,543 | 100 | 58 | 714 | 99.9 |
| Merced | 11,094 | 100 | 100 | 0 | 100.0 |
| Modoc | 175,399 | 100 | 55 | 15702 | 91.0 |
| Mono | 7,076 | 100 | 0 | 134 | 98.1 |
| Monterey | 133,512 | 83 | 16 | 2705 | 98.0 |
| Napa | 50,045 | 8 | 0 | 615 | 98.8 |
| Nevada | 188,880 | 79 | 0 | 1109 | 99.4 |
| Orange | 899 | 0 | 0 | 1738 | -93.4 |
| Placer | 117,489 | 76 | 0 | 1614 | 98.6 |
| Plumas | 175,870 | 100 | 0 | 8309 | 95.3 |
| Riverside | 6,512 | 56 | 21 | 414 | 93.6 |
| Sacramento | 332 | 9 | 0 | 390 | 0.0 |
| San Benito | 66,498 | 100 | 0 | 1066 | 98.4 |
| San Bernardino | 14,323 | 95 | 12 | 193 | 98.7 |
| San Diego | 21,645 | 88 | 67 | 1238 | 94.3 |
| San Joaquin | 2,133 | 0 | 0 | 0 | 100.0 |
| San Luis Obispo | 167,135 | 13 | 0 | 758 | 99.5 |
| San Mateo | 43,832 | 0 | 0 | 55 | 99.9 |
| Santa Barbara | 87,194 | 67 | 1 | 1770 | 98.0 |
| Santa Clara | 99,380 | 5 | 0 | 61 | 99.9 |
| Santa Cruz | 86,831 | 14 | 0 | 432 | 99.5 |
| Shasta | 556,829 | 100 | 29 | 7156 | 98.7 |
| Sierra | 49,791 | 100 | 0 | 289 | 99.4 |
| Siskiyou | 523,573 | 100 | 22 | 4727 | 99.1 |
| Solano | 3,562 | 13 | 0 | 69 | 98.1 |
| Sonoma | 231,000 | 71 | 1 | 648 | 99.7 |
| Stanislaus | 14,168 | 100 | 72 | 0 | 100.0 |
| Sutter | 0 | 0 | 0 | 0 | 0.0 |
| Tehama | 165,836 | 100 | 100 | 6371 | 96.2 |
| Trinity | 247,192 | 100 | 30 | 297 | 99.9 |
| Tulare | 38,178 | 36 | 36 | 1179 | 96.9 |
| Tuolumne | 100,628 | 84 | 1 | 229 | 99.8 |
| Ventura | 17,972 | 52 | 2 | 568 | 96.8 |
| Yolo | 2,144 | 55 | 55 | 0 | 100.0 |
| Yuba | 71,432 | 78 | 0 | 4174 | 94.2 |
Fire hazard is fire damage (property damage) whereas fire experience is frequency of fires. Median income in communities that have had 6 or more fires since 1990 is $66,128 whereas those with 1-2 fires have a median income of $100,063 (Hino and Field).
Utilized data from the Wildfire and Forest Resilience Task Force’s Beta Treatment Tracker Dashboard to determine acres in treatment and percent of those acres that are privately owned WFRTF (2024).
Ibid.
- USDA. (2024). Focus on Forestlands in California. USDA Climate Hubs. https://www.climatehubs.usda.gov/hubs/california/topic/focus-forestlands-california
- CFF. (2024). California Forests. California Forest Foundation. https://www.calforestfoundation.org/resource/california-forests/
- OEHHA. (2024). Wildfires - OEHHA. https://oehha.ca.gov/climate-change/epic-2022/impacts-vegetation-and-wildlife/wildfires
- FIRE, C. (2024). Statistics. CAL FIRE. https://www.fire.ca.gov/our-impact/statistics
- Hino, M., & Field, C. B. (2023). Fire Frequency and Vulnerability in California. PLOS Climate. 10.1371/journal.pclm.0000087
- Chen, C., Schwarz, L., Rosenthal, N., Marlier, M., & Benmarhnia, T. (2024). Exploring Spatial Heterogeneity in Synergistic Effects of Compound Climate Hazards: Extreme Heat and Wildfire Smoke on Cardiorespiratory Hospitalizations in California. Science Advances, 10(5). 10.1126/sciadv.adj7264
- Pohl, J. (2024). Wildfire Smoke Disproportionately Affects California’s Indigenous Communities, New Research Shows. Berkeley News. https://news.berkeley.edu/2024/02/29/wildfire-smoke-disproportionately-affects-california-s-indigenous-communities-new-research-shows/
- Secaira, M. (2023). Frequent Wildfires More Likely to Hit Low-Income Communities, New Report Finds. Capital Public Radio. https://www.capradio.org/articles/2023/02/15/frequent-wildfires-more-likely-to-hit-low-income-communities-new-report-finds/
- WFRTF. (2021). California’s Wildfire and Forest Resilience Action Plan: Recommendations of the Governor’s Forest Management Task Force. California Wildfire. https://wildfiretaskforce.org/wp-content/uploads/2022/04/californiawildfireandforestresilienceactionplan.pdf
- Hatfield, M. (2001). Wildfire and Poverty: An overview of the interactions among wildfires, fire-related programs, and poverty in the Western United States. Scholars’ Bank. https://scholarsbank.uoregon.edu/xmlui/bitstream/handle/1794/2334/wild_pov.pdf
- Shahir Masri, Erica Scaduto, Yufang Jin, & Wu, J. (2021). Disproportionate Impacts of Wildfires among Elderly and Low-Income Communities in California from 2000 to 2020. NCBI. https://www.ncbi.nlm.nih.gov/pmc/articles/PMC8068328/
- Environmental, A. (2024). CalVTP Homepage and Storymap. Board of Forestry. https://bof.fire.ca.gov/projects-and-programs/calvtp-homepage-and-storymap/
- PPIC. (2024). Poverty. OEHHA. https://oehha.ca.gov/calenviroscreen/indicator/poverty
- USDA. (2023). Poverty Area Measures. USDA ERS. https://www.ers.usda.gov/data-products/poverty-area-measures/
- USGS. (2018). National Land Cover Database. USGS. https://www.usgs.gov/centers/eros/science/national-land-cover-database